How To Make Infographics in PowerPoint
Creating Infographics is a concise yet highly informative way of conveying your message to your audience. Through infographics, you can tell an otherwise lengthy process, story, history, and comparison in one page. However, creating infographics using Adobe Illustrator, Adobe AfterEffects, or even Adobe PowerPoint can be a time-consuming and meticulous process.
Anyone who would want to create impressive infographics with the software you already have software that you already have, you can create infographics in PowerPoint.
Aside from being time-saving, using PowerPoint for infographics is easy. To start with, you can create infographics using hundreds of readily available PowerPoint templates and eye-catching infographic templates from our website.
All you have to do is look for an infographic template that best matches your theme, subject, topic, or idea, and you can efficiently work around that template. For more specific needs, you can read on and follow the instructions on creating infographics using PowerPoint.
From the article How to Make an Infographic in PowerPoint by SlideModel, we can learn that an Infographic is a visual that tells a story with data and information. In this article, multiple infographic types are recommended for different situations, like Informational Infographics, Data Infographics, and Process Infographics.
Related: Read the article Animated PowerPoint Infographic Template
So, how to make an infographic in PowerPoint? (Simple steps)
Let’s see how to create infographics in PowerPoint. Here are some easy steps to follow:
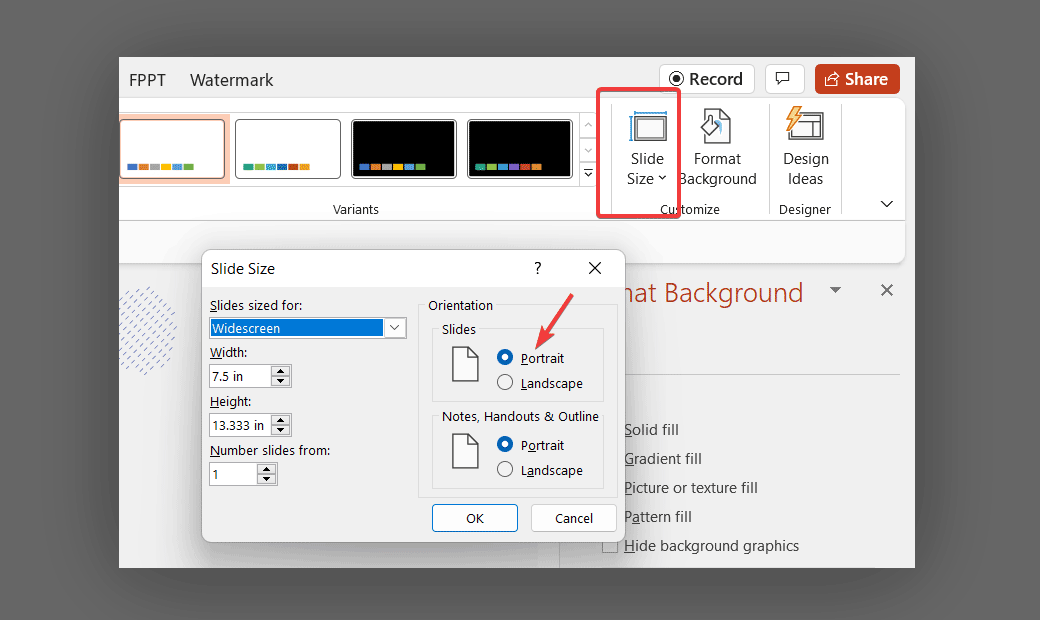
Step 1: Start with a blank presentation and a new slide. Change the slide orientation to Portrait.
Step 2: Change the slide’s size to 7.5″ width by 13.333″ or 12″ height. We are changing the slide size and aspect ratio of your PowerPoint presentation to be best for an Infographic slide.
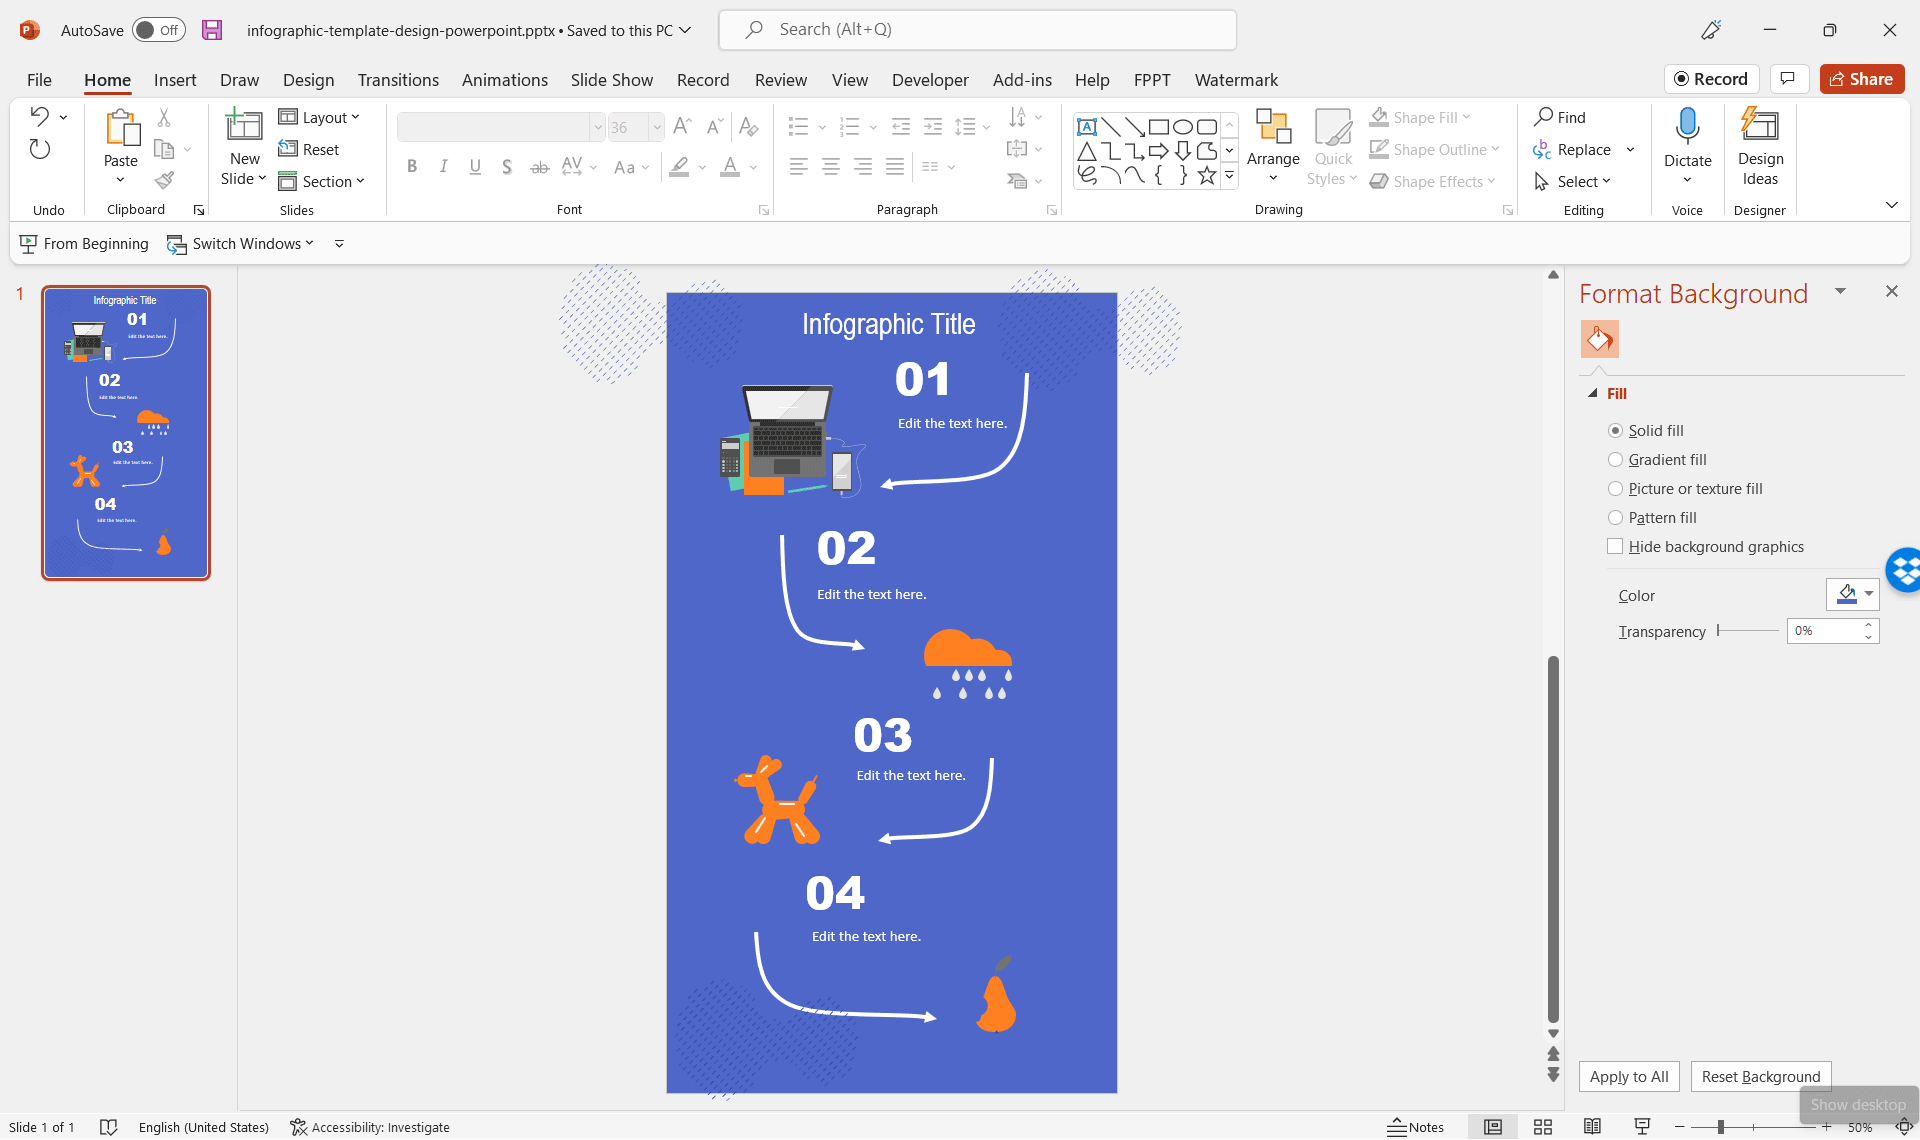
Step 3: From here, you can start creating your infographic using the Drawing function of PowerPoint. You can create shapes and put text into shapes, as well as add your own images. To show a process, you can create diagrams using SmartArt. Meanwhile, you can also create tables, charts, and graphs.
You can also use the Insert -> Icons option, which will popup a dialog box like this:
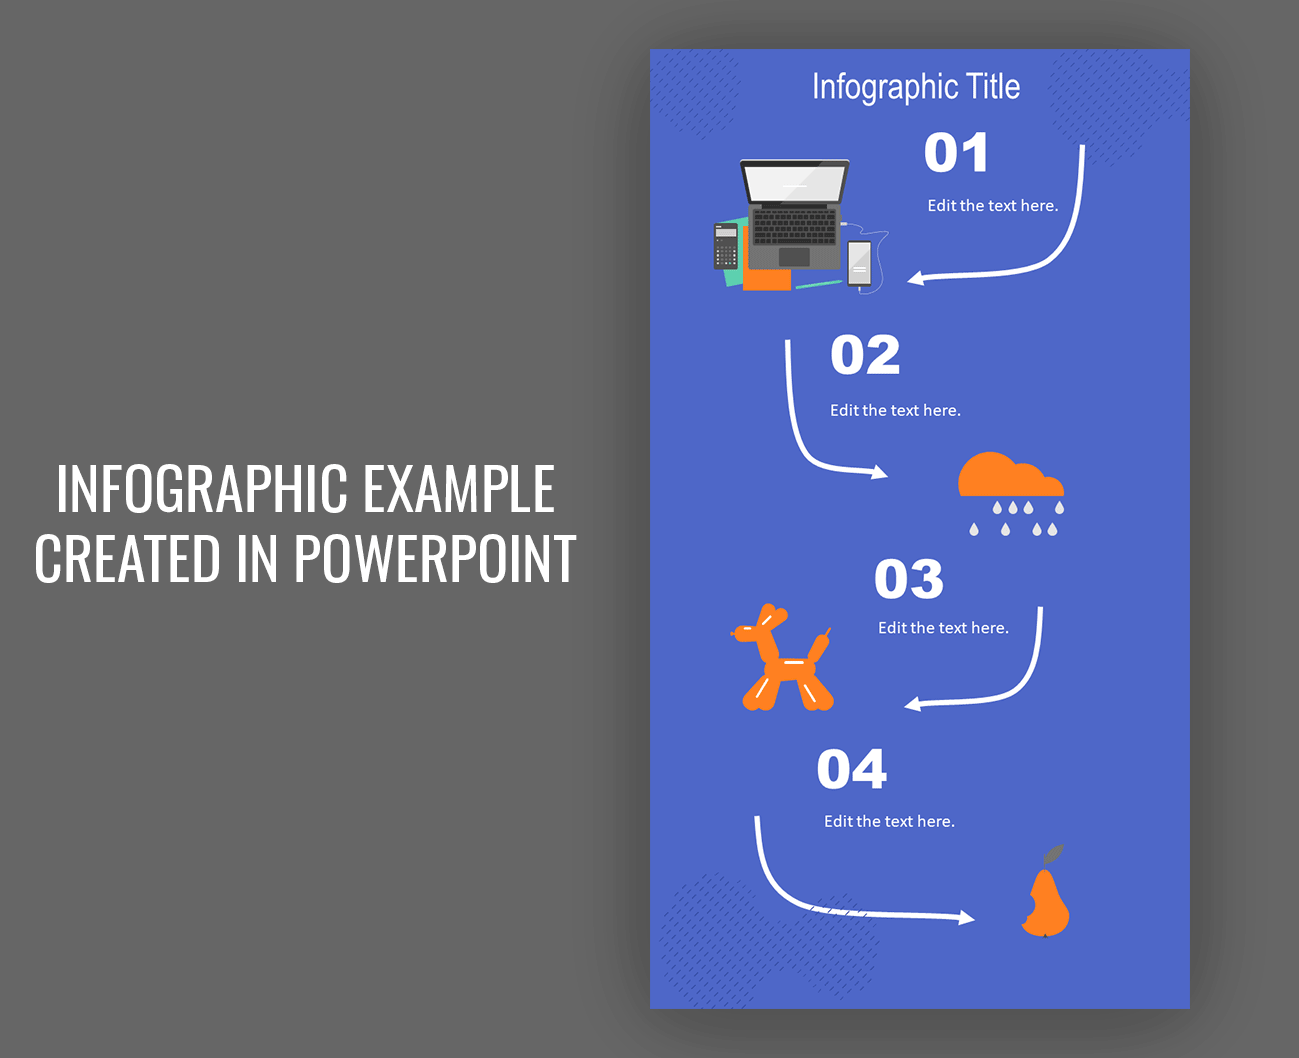
Here, you are not only limited to insert icons, but you get access to a massive collection of graphics and assets, including cartoon people, cutout people, stickers, videos, and illustrations. For this demo, we have used the PowerPoint Illustrations tab to find some valuable designs for our simple infographic example created in PowerPoint.
Step 4: Once you have completed your infographic, you can now easily find a theme. Just choose from the numerous slide background designs and color themes.
Step 5: Once your infographic is complete, you can save it as PDF, using the minimum size, to publish it online. Click File -> Save As and then choose the .PDF format.
Creating eye-catching infographics with PowerPoint is easy as they can be created following the steps mentioned above. However, it is important that you keep your audience engaged while they view your infographic. As such, you should ensure its design and layout are captivating. Further, use simple yet effective CTAs to encourage the readership to click on them and learn more about your product or service.
Conclusions
If you want to know more about infographics, we recommend you to read more about the Infographics history and to check some of the best websites to make infographics. You can also leverage the use of AI tools to make infographics. There are some AI infographic generators and tools that you can use. ChatGPT can also give you some ideas about what graphics to put in your infographics, and what’s more important, if your infographics includes facts, you can ask ChatGPT to provide ideas for you to use.
But now that you know how to make an infographic in PowerPoint, it’s time to start creating stunning visuals for your upcoming business presentations. By combining efficient design and effective use of data visualization features, you can make impressive designs that grab attention. If you want to save time creating infographics, you can download free infographics templates for PowerPoint or create your own from scratch with the techniques described in this article.
Great tutorial but I have PP 2013 and I can do a lot more with it compared to older version you’re using in screenshot. Thanks for this tut.
Thank you sooooooo much for this!! Trying this method today
We are glad to know that you are trying this method to create infographics. If you require Infographics PowerPoint templates I’d strongly recommend you this infographics PPT template as an alternative to this method or other tools like Piktochart.
Thanks, but is there an option to make really beatiful infographics with PP?
I doubt – the more you want to go into details, the more things someone will miss, e.g. multi-page/screen handling etc.
Its a nice start, though; but for professional use, … good luck 😀
Dear Konto.
Thank you for leaving your comment. This article is old dated and today there are plenty of tools available and infographics makers. For professional use I’d say that Illustrator or Photoshop can be a good fit, but if you want to try a different approach I’d suggest to check the Infographic Slides at SlideModel.com. Combining their shapes into a slide can help to create infographics without leaving PowerPoint editor.
This is great tutorial I do believe that it will be more helpful for basic power point user. Thank you!