How to Create a Curved Line Charts in PowerPoint
By default, when you insert a line chart in PowerPoint, the lines are straight, but did you know you can make these lines curved in PowerPoint? Using the smoothered line we can make those lines curved in PowerPoint charts. In this article, we explain you how.
To make the lines curved, you can change a line property available in the chart configuration.

Instead of creating the curved line manually, use the smoothed line checkbox under Marker Line Style to apply this style to the data serie.
To access this property, you can double click on the chart line and then select Marker Line Style or access it from the right menu.
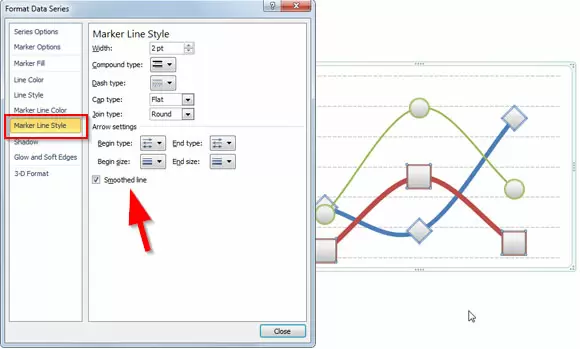
Now, you can see the difference below. On the left, we can see the original line chart and on the right there is a new version using smothered line for the three data series.

As you can see, you can quickly convert your traditional line charts in PowerPoint to a sexy curved line. Of course this may not be suitable for all the cases when you need accurate plots but you can use this PowerPoint tip to make impressive charts in PowerPoint or apply ideas to improve your free PowerPoint charts.
You may want to correct the spelling from “smothered” to “smoothed”. Thanks for the great information !
Hi Randy. Thank you for your comment and correcting the spelling for that word. That means you really read the article. Have a good day.
Great information.