Learn how to insert line charts and line graph in PowerPoint presentations and see real examples of line charts used for presentations in PowerPoint. You can design line charts and customize the chart look and feel to create stunning graphics and visualizations in PowerPoint presentations.
In PowerPoint, you can save your chart design as a chart template for future use. This feature can be really helpful if you want to design custom charts using styles and effects and save it as a template using your corporate visual identity or brand identity. You can also use chart templates to speed up …
If you need to prepare excellent business presentations then you can opt either to create your own presentation and slide design from scratch, reuse any of the PowerPoint presentation templates that you can download for free from our site, or purchase any premium PowerPoint template from sites like PresenterMedia that offer awesome animated PowerPoint templates …
If you need to add a title to a PowerPoint chart using Microsoft PowerPoint then here are a few quick tips that can help you. There are multiple ways to add a title to a PowerPoint Chart using Microsoft Office. Method #1 – Add a Presentation Slide Title The easiest way to add a catchy …
The Evolution of the Web is a project created by Vizzuality, Hyperakt, and members of the Google Chrome team that helps to visualize the main milestones of the World Wide Web using a nice visualization tool (based on a timeline). The Evolution of the Web is the outcome and you can check it on their …
Need help in building an appropriate chart using Microsoft Excel or PowerPoint? How about simply downloading some well made chart templates to get the job done in a snap? Chart Chooser is a website that provides Microsoft PowerPoint and Excel chart templates for free. All you have to do is to sort through the various chart …
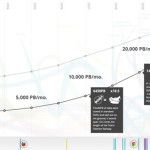
Today we will show you how to make a Double-Line Graph in PowerPoint so you can create your own charts and graphs for business and economic presentations, but also useful for other presentation topics like statistics, physics and why not marketing research. You can use the same concepts learned here to make double bar graphs, …
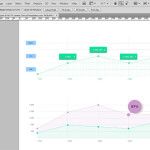
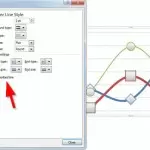
By default, when you insert a line chart in PowerPoint, the lines are straight, but did you know you can make these lines curved in PowerPoint? Using the smoothered line we can make those lines curved in PowerPoint charts. In this article, we explain you how. To make the lines curved, you can change a …
Advertisement
The Latest FPPT Templates Delivered To Your Inbox
We will send you our curated collections to your email weekly. No spam, promise!