How to Change PowerPoint Chart Size & Position
You can easily change the PowerPoint chart size & position to match any desired chart and slide design. Here we will show you how easily it is to change the chart position using PowerPoint and adjusting the PowerPoint chart size.

How to change the height, width and depth in bar chart in PowerPoint?
You can drag the borders of the chart and then expand the chart size horizontally or vertically. However, if you access the chart properties there is an option under Size that let you change the size properties like height and width. You can also scale the chart by X factor and lock the aspect ratio, which may be very useful if you need to show many charts in the same slide and want to keep the same scale.
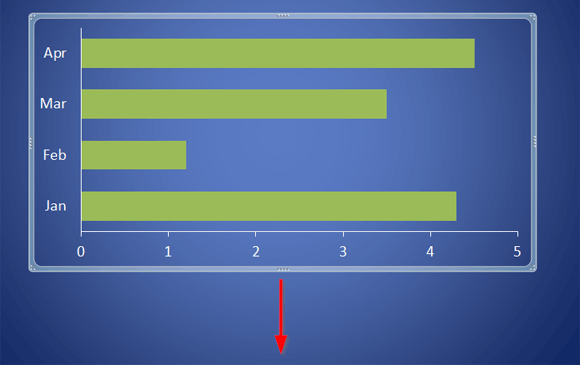
The figure above shows how to change the PowerPoint chart size vertically. Just drag the bottom border down and then the chart will expand.
Change the PowerPoint chart size – Step by Step
To change bar chart Height in PowerPoint, drag the chart borders using your mouse or follow the steps below:
- Right click over the chart and then choose Format Chart Area
- Select Size
- Enter a desired width and height
Change position of the Chart in the PowerPoint slide
Easily you can drag and drop the chart over the slide to move the position until finding the right placement where you want to put the chart, or alternatively you can manually change the chart position as follows:
- Right click over the chart and choose Format Chart Area
- Select Position tab
- Enter the horizontal and vertical position and choose the From: value as Top Left Corner or Center.
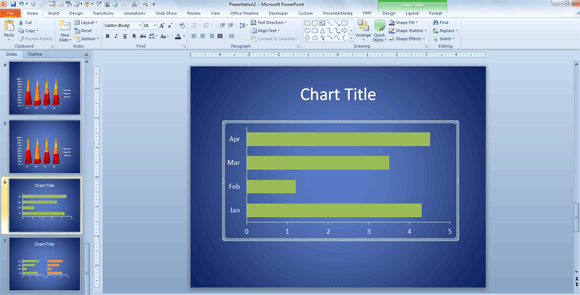
Here is an example of the PowerPoint chart after fitting the whole slide.
If you need to change the gap between the series or use a diagonal gradient up style to fill the bar chart series.
If you want to center the chart or align it within the slide then you can use the align options, which is a powerful tool to quickly place the chart centered in the slide design. You need to click on Chart Tools menu and then choose Format submenu. Now look for Align button and click Center.