Learn how to create Bar Chart PowerPoint presentations and slide designs with awesome graphics to present your charts and data. Download free bar chart templates for presentations.
One of the things that can really help you present statistical information in an easy to grasp manner are charts. PowerPoint charts can be a great way of making attractive data visualizations for interpreting and presenting essential data. When making chart slides, the easiest method for saving time and getting the most out of your …
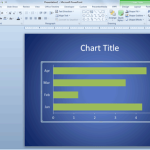
Sometimes you need to change the bar in a bar chart while using Microsoft PowerPoint. This article can help you to understand how to edit the chart and change the default bar width. Actually yo change the bar width used in a PowerPoint chart you change the gap width (the space between one bar and …
When it comes to productivity and collaboration, Microsoft Office is leading the game. Not only does it have the most advanced programs and features; it also keeps updating them to suit the needs of today’s users. One of its biggest selling points today is its collaborative feature. This allows Office users to work on the …
Want to make printable infographics using PowerPoint? Or do you wish to present your slides with infographics? Infographic templates for PowerPoint can help you create Infographic designs using flexible slide layouts and graphics, with clipart, animations and well placed placeholders that can help you visually represent your content with a clean layout and attention grabbing …
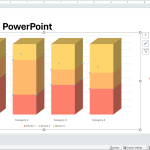
You can easily change the PowerPoint chart size & position to match any desired chart and slide design. Here we will show you how easily it is to change the chart position using PowerPoint and adjusting the PowerPoint chart size. How to change the height, width and depth in bar chart in PowerPoint? You can …
If you need to prepare excellent business presentations then you can opt either to create your own presentation and slide design from scratch, reuse any of the PowerPoint presentation templates that you can download for free from our site, or purchase any premium PowerPoint template from sites like PresenterMedia that offer awesome animated PowerPoint templates …
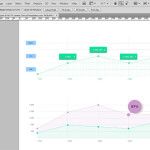
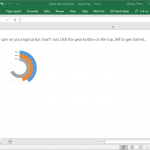
These days, there are many fun, vibrant and creative ways to visualize your data. Beyond the usual bar, line, and pie charts, there are many add-ins that can help you spruce up your data and related reports. One of these is the Radial Bar Chart add-in for Excel.
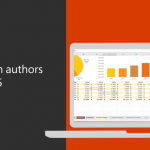
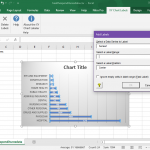
When you’re creating charts and graphs in Excel, the process is pretty much straightforward. You use the built-in Wizard within Excel to create compelling visuals that analyze and represent your data. Usually, when you create charts, you can format your chart labels with Series Name, Category Name, and Value. You can label them however you …
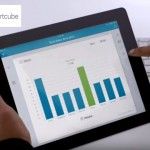
ChartCube is a free web app with applications for Android and iOS devices which instantly transforms spreadsheets to analyzable data. With ChartCube data analysis is as easy as it gets, as you can view pivots via swipe and double tap to drill down your data with the ability to collaborate online and present information like …
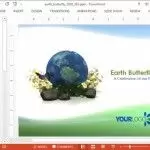
Green Earth is an environmental PowerPoint template by Presenter media which depicts an animation of a rotating globe amidst yellow flowers and a butterfly. This PowerPoint template can help you create animated slides for topics related to the environment, be it environmental issues, recycling, green energy, conservation or topics related to wildlife, the ecosystem, global …