How To Make A Flowchart in PowerPoint
Last updated on November 12th, 2024

A flowchart is meant to display a task or process in a sequence. Such charts are often required for making business diagrams, models showing production processes and tasks. There are various methods by which you can create flow charts in PowerPoint, including with the help of SmartArt Graphics, shapes and readymade templates.
What is a Flow Chart?
A flow chart is a visual representation of a process or system, using symbols and arrows to show the flow of information or steps in a sequence. Flowcharts can be used to present complex concepts, illustrate workflows, decision-making processes, and any other system or process that has multiple steps or components. Flowcharts are widely used in business, engineering, healthcare, education, and other industries to improve communication, analyze processes, and identify areas for improvement.
How To Create Flowcharts With SmartArt in PowerPoint
The best method to create flowcharts on your own is with the help of SmartArt Graphics in PowerPoint. This method is even recommended by Microsoft in its Office.com support section. Below is a complete guide that shows how to create a flow chart using SmartArt.
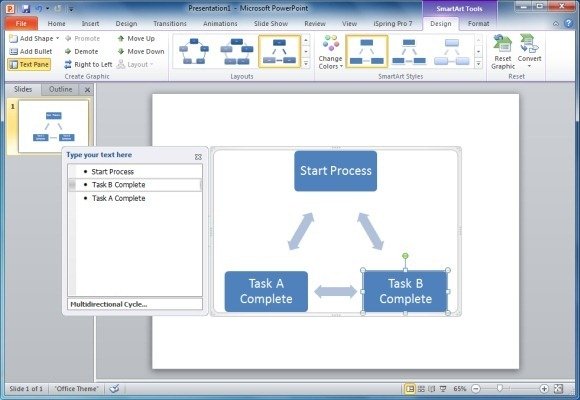
Step 1: Select A SmartArt Graphic
In the first step, go to Insert->SmartArt and select a graphic for making your flow chart. There are various graphics that you can use for this purpose. However, the best SmartArt graphics include the ones in the Lists, Process, Cycle, Hierarchy and Relationship sections.
Automatic Flowchart Maker
Someka Flowchart Maker Templates
Flowcharts are used in different areas to report, study, plan and even maybe develop the whole complex processes to turn them into an easy-to-understand diagram. From a simple task to a complex process, flowcharts can be a really useful tool for what you are working on. This Automatic Flowchart Maker has a database that you can input your data and it creates your flowchart according to your needs.

Step 2: Add Process Layout Information
In the next step, fill the boxes to create a sequential process layout. When making a flowchart make sure that the shapes you use are appropriately placed.
Step 3: Add Shapes To The Flowchart
You can add additional shapes to the flowchart from the Add Shape menu in SmartArt Tools. This can allow you to add additional shapes to your flowchart. This is specially useful when creating a behavior flow chart.

Step 4: Change Shape Type To Reflect The Right Symbol
As mentioned earlier, different shapes in a flowchart represent different meanings, therefore; it is important to use the right shape for each section of the flowchart. You can format the flowchart shapes by right-clicking on a shape and going to Change Shape. As you can see from the screenshot below, you can select specific flowchart shapes from this menu. If you are not sure about which shape to apply; hover your mouse over a shape for its name to appear.
Note: Each shape in a flow chart holds a special meaning, make sure you use the right shapes to show the process in sequence. To see the meaning of different shapes in a flowchart check out our post: Meaning Of Different Flowchart Symbols.

Step 5: Format Your Flowchart Design in PowerPoint
You can tweak your flowchart to give it an appropriate design via SmartArt Styles. Furthermore, you can change the colors for your SmartArt Flowchart from Change Colors menu (in SmartArt Tools). Similarly, you can pick a background color for your slide from the Design tab in PowerPoint.

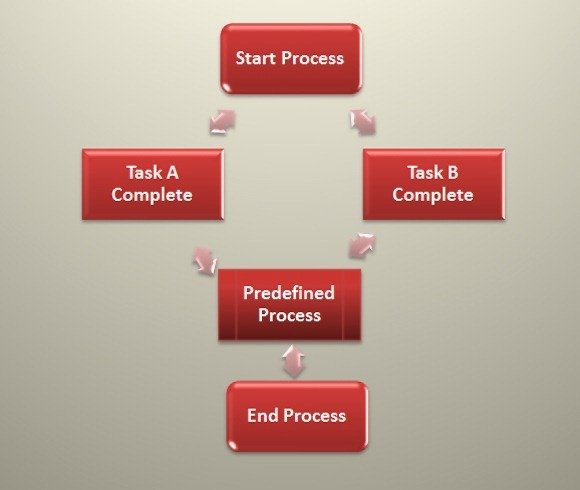
Flowchart Examples: Examples of Flow Charts made with SmartArt Graphics in PowerPoint
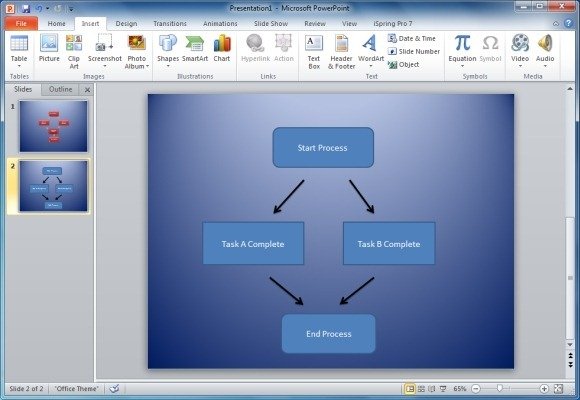
The below image shows a sample Flowchart made with SmartArt Graphics in PowerPoint.
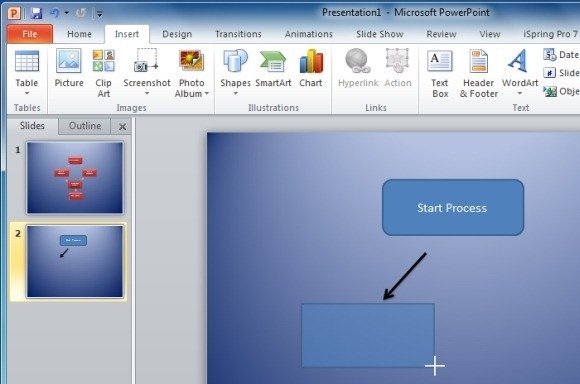
How To Create Flowcharts With Shapes in PowerPoint
You can also make flowcharts using shapes. To add shapes to PowerPoint go to insert-> Shapes.

After selecting the required shape drag your mouse over the slide to generate the selected shape.
To format an individual shape, select the shape and go to Quick Styles or make use of the plethora of options that will appear from the Ribbon Menu in Drawing Tools.
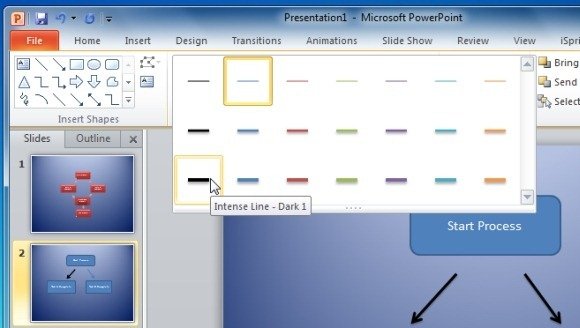
The below screenshot shows a sample flowchart created with shapes in PowerPoint.
How Flow Charts are used in different industries and sectors?
Flowcharts are widely used in business and education. Here are some possible applications of flowcharts in different industries and sectors:
Flowcharts for Business Presentations
In business, flow charts are commonly used to represent workflows, procedures, and decision-making processes. They can help teams identify bottlenecks and inefficiencies in a process, leading to more streamlined and efficient operations. Flow charts can also be used to map out customer journeys, organizational structures, and data flows. You can also use a process map template, with a diagram that help audience to visualize a process and details the individual steps involved in the task.
Flowcharts in Engineering
In engineering, flow charts are often used to represent technical processes such as manufacturing processes, software development processes, or systems engineering processes. They can help engineers identify areas for improvement, troubleshoot problems, and ensure that processes are operating efficiently and effectively.
Flowcharts in Healthcare Sector
In healthcare, flow charts can be used to illustrate patient journeys, treatment plans, and clinical decision-making processes. They can help healthcare professionals communicate complex information to patients and colleagues, identify inefficiencies in processes, and improve patient outcomes.
Flowcharts in Education
In education, flow charts can be used to illustrate concepts and workflows in scientific presentation templates, such as the scientific method, problem-solving processes, or organizational structures. They can help students visualize complex information, understand processes more easily, and improve their critical thinking skills.
Flowchart PowerPoint Templates
If you find it too laborious to create flowcharts using shapes or SmartArt, then you can opt for Flowchart PowerPoint templates. Below are a few customizable PowerPoint flowchart templates that you can use for making flowcharts easily.
1. Free Simple Flowchart PowerPoint Template (Free)
This simple free Red Flow Chat template was created in PowerPoint and can be used as a flowchart template to make simple flowcharts.
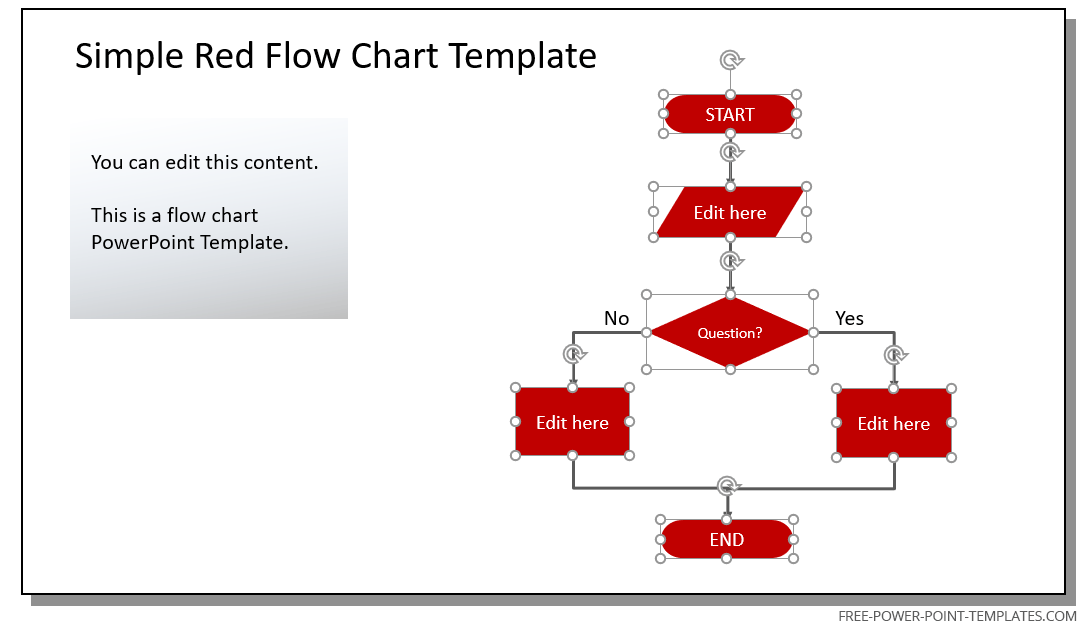
In the screenshot above, we can see how a simple Yes/No flowchart is created with the PowerPoint shapes. Easily, the presenter can adjust the nodes and connectors to produce any other variant of this flowchart.
2. Process Flow Diagram Template For PowerPoint
This is an excellent premium diagram template for PowerPoint which provides an editable process flow chart that can be used for making a flowchart in no time. This template comes with a number of sample slides that offer a variety of sample flowcharts that can be customized to suit your needs.
Go to Download Process Flow Diagram Template For PowerPoint

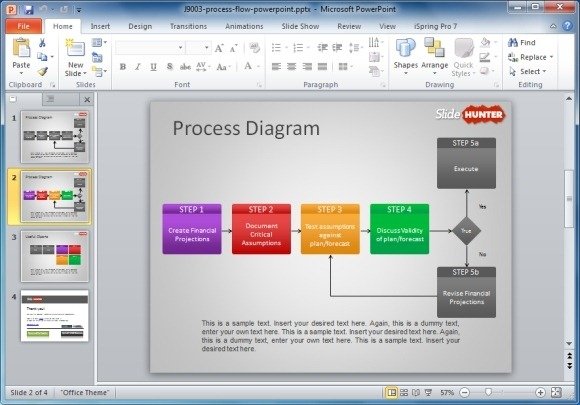
3. Free Process Flow Diagram Template for PowerPoint
This is another fine flowchart diagram template with different sample slides that provide sample flowcharts. This template even comes with a standalone slide with given clipart to help you copy/paste shapes across various slides for conveniently making flowcharts.
Go to Download Free Process Flow Diagram Template for PowerPoint
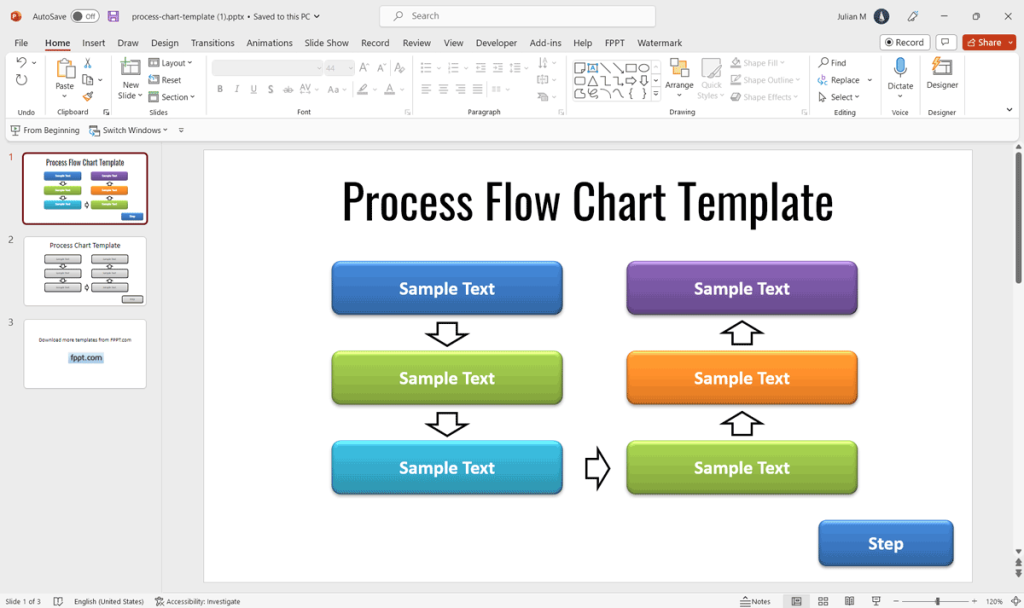
4. Free Simple Process Chart PowerPoint Template
This is another free flowchart template that can be used for making conventional and business flowcharts. While the sample slides in this template appear less like a typical flowchart, however you can move around the shape and arrows to easily construct a decent flowchart with some nice graphics.
Go to Download Free Simple Process Chart PowerPoint Template
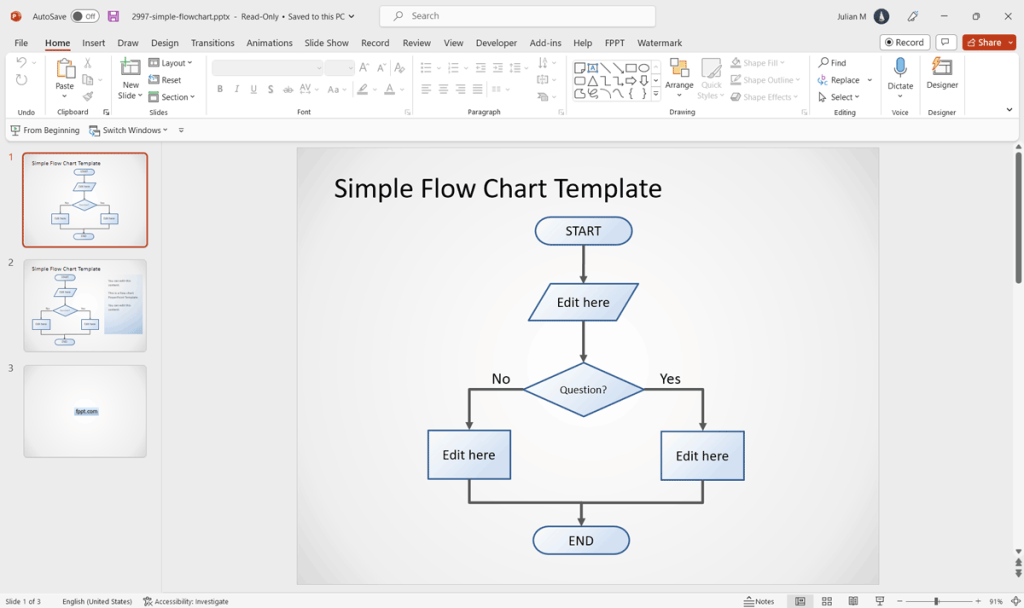
5. Simple Free PowerPoint Flowchart Template
This simple flowchart template design for PowerPoint can be used to illustrate a Yes/No workflow. How to create a workflow diagram in PowerPoint like this picture? We used shapes in PowerPoint with the line connectors.
Go to Download Simple Free PowerPoint Flowchart Template
FAQs
A flow chart is a diagram that represents a process or system using symbols and arrows to illustrate the flow of steps in a sequence. It is ideal for visualizing tasks, processes, and decision-making workflows. A process map, on the other hand, provides a more detailed view of the entire workflow, including specific tasks, resources, and roles involved. Process maps often offer more contextual information, focusing on the “who” and “what” of each step within a process.
In PowerPoint, you can create flowcharts using SmartArt Graphics or by using shapes manually. Both methods allow for customization and flexibility. Additionally, PowerPoint offers various flowchart templates that can make the process faster and easier.
Different shapes in a flowchart have specific meanings, such as ovals for start/end points, rectangles for processes, diamonds for decision points, and arrows for showing flow direction. Using the correct shapes ensures that the flowchart accurately represents the process and makes it easy to understand.
Yes, there are many customizable PowerPoint templates designed for creating flowcharts. These templates can save time and offer pre-designed layouts that are easy to adapt for your specific needs.
The best Microsoft apps for creating flowcharts include Microsoft Visio, which is specifically designed for diagramming and offers comprehensive tools for creating detailed flowcharts and process maps. Microsoft PowerPoint is another option for simple to moderately complex flowcharts, using SmartArt and shapes. Microsoft Excel can also be used for basic flowcharts with its drawing tools and templates.
Final Thoughts
Overall, flow charts are a powerful tool for visualizing processes and systems, improving communication, and identifying areas for improvement. Whether you are a business owner, engineer, healthcare professional, or educator, flow charts can help you better understand and optimize your processes and workflows.
Other than PowerPoint you can also draw flowcharts with the help of various third-party tools. For more details, see our post about Best Paid And Free Flow Chart Makers or you can download chart and diagrams for PowerPoint presentations. Alternatively, you can download a premium Flow Chart template for Excel spreadsheets or learn how to make a flowchart in Excel instead.
We will send you our curated collections to your email weekly. No spam, promise!
Can we save the diagrams we create from powerpoint on the cloud to be accessed by the live account on the internet?
Recommend to use draw.io
Japanese cars, should be designed and built
by Japanese people, in Japan.