You can find many free resources and articles on making excellent diagrams for PowerPoint and PowerPoint diagram tools in this category.
You can learn to make 2D and 3D diagrams using essential tools like shapes and PowerPoint SmartArt graphics. Designing diagrams for presentations is a common task, but many business diagrams can be found for free and quickly inserted into your PowerPoint presentations.
Gauges have lots of drawbacks in corporate dashboards but sometimes this is what the customer want to see, especially top managers and CEOs. Aside of other visualization tools, gauges can be very basic and decorate your reports or PowerPoint presentations. By default PowerPoint do not come with gauge templates that you can use for your …
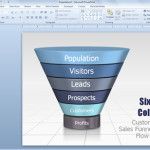
Drawing a funnel diagram in PowerPoint is possible by combining different basic shapes like an ellipse or oval and then a triangle. You can also create pipes in PowerPoint using shapes. Here we will show you how to build a simple funnel diagram in PowerPoint. You can combine different shapes to build this funnel channel …
A flowchart is meant to display a task or process in a sequence. Such charts are often required for making business diagrams, models showing production processes and tasks. There are various methods by which you can create flow charts in PowerPoint, including with the help of SmartArt Graphics, shapes and readymade templates. What is a …
In PowerPoint you can make org chart and other tree graphics easily using SmartArt graphics, for example if you need to make a family tree or display data in a tree. However, in some situations it would be enough to use shapes and use lines to connect the tree. Here we will show you a …
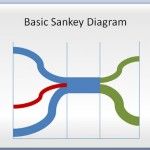
Sankey diagrams are a specific type of flow diagram that are widely used in thermodynamics and material flow management. In this kind of diagrams, the width of the arrows is shown proportionally to the flow quantity. You can use this kind of Sankey Diagrams as a visualization of energy, material or cost transfers between processes. …
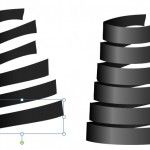
Spiral charts and Spiral diagrams can help to describe processes and concepts in PowerPoint presentations. But designing such diagrams usually require lot of time or we end purchasing premium templates from websites offering PowerPoint templates and diagrams. We can design the spiral diagram in PowerPoint using a very basic approach that includes the use of …
There are lot of diagram designs that we can purchase and download from stock images, but if we are interested to make our own SWOT diagram in PowerPoint then we can use the powerful SmartArt and Shapes feature to design it. Then we can apply some nice styles and effects to make it awesome. In …
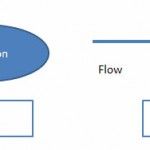
A data flow diagram is a visual representation of data flow in an information system. Data flows are an important visualization tool to model processes. You can use Data Flows to create an overview of the system which can later be elaborated just like a simple mind map diagram, or you can also use DFD …
In this tutorial, we’ll be creating a flowchart using SmartArt in PowerPoint. These shapes are very stylized versions of normal shapes available in PowerPoint to make a collective of shapes for different purposes. If you refer to our prior tutorial on creating flowcharts, you’ll find the same procedures apply here. Before starting, have your data …
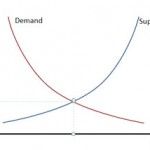
In PowerPoint you can insert diagrams and charts easily but sometimes you need some generic diagrams or business charts for your presentations. Instead of creating the data-driven charts with real data from your spreadsheets, you can just draw a chart using shapes which will be enough in some cases to denote and present an idea, …
Advertisement
PowerPoint diagrams can be used to enhance the way you present topics and concepts in PowerPoint. While you can use diagram templates to prepare your presentations, in ocassions you may want to create diagrams from scratch and customize them as per your needs. Some PowerPoint diagram tools can ease the process of creating all kind of business diagrams that can be edited by the presenter or presentation designer. Hence, in this section we include articles related with the diagram creation process in PowerPoint.