How to Make Bubbles Chart in PowerPoint
Last updated on December 21st, 2025
A bubble chart is a variation of a typical Scatter chart or graphic where you can place data points with different sizes, similar to bubbles. In fact, in the bubbles chart, the data points of scatter plots are replaced with bubbles. A Bubble chart can be used instead of a Scatter chart if your data has three data series, each of which contains a set of values.

You can have values for three types of data like number of products, volume of sales, and percentage size of market share. Here we will show you how to create a Bubbles Chart in PowerPoint.
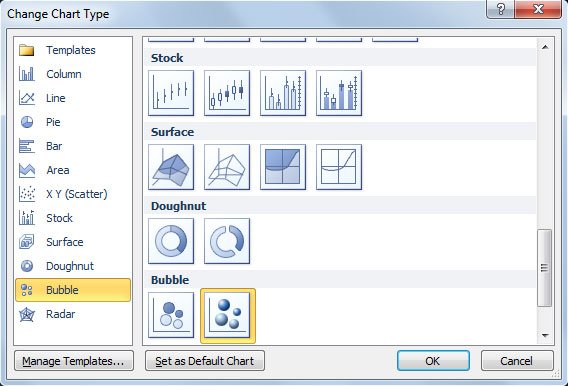
To create your first bubble diagram in a PowerPoint presentation, you need to choose the Bubble Chart from the collection of charts. If you need more help about how to insert a chart in PowerPoint then you can refer to our related posts.
Alternatively you can also check the following related articles.
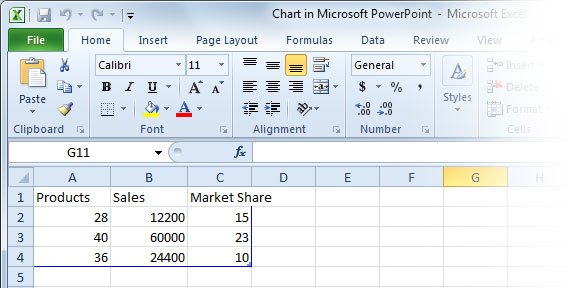
Now it is time to prepare the data. As said, the bubble chart expect at least three series and it is an alternative to 3D Charts. The 3rd serie is represented by the size of the bubbles, as you can see in the example below.
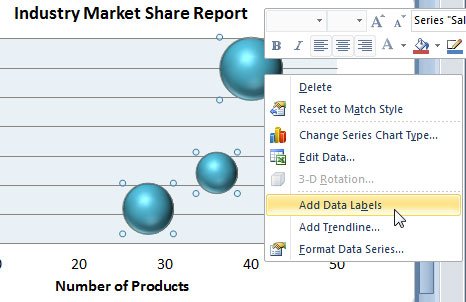
If you need to add data label to the bubble chart then you can right click on any bubble and click on Add Data Labels option, this option is just above the Add Trendline option.
Application of bubble charts created with PowerPoint:
- Cost, volume, profit analysis
- Key customer account ranking charts
- Use a buble chart as a bar chart alternative
You can use bubble charts to present financial data and reports. For example, use a Bubble chart when you want specific values to be more visually represented in your chart by different bubble sizes or if you need an alternative to 3D charts as a visualization tool for reports. Bubble charts are useful when your worksheet has any of the following types of data:
- Three values per data point: x value, y value, and then size value.
- Negative values Bubble sizes can represent negative values, although negative bubbles do not display in the chart by default.
- Multiple data series Plotting multiple data series in a Bubble chart (multiple bubble series) is similar to plotting multiple data series in a Scatter chart (multiple scatter series).
If you need more information about bubble charts, bubble diagrams and how to insert other types of charts in your PowerPoint presentations, you can visit our other articles or subscribe to our newsletter. Or if you need to download free PowerPoint templates and backgrounds for your financial reports, then you can find lot of different PPT backgrounds.