Advertisement
Make a Timeline in PowerPoint using Adobe Presenter 8
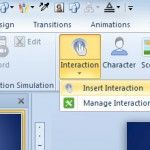
Adobe Presenter comes with an Interactions menu that allows us to insert rich diagrams including animated charts and graphics, but also nice timelines for PowerPoint. Using Interactions Timelines you can make a simple but descriptive timeline in PowerPoint for your milestones and events. In order to insert a timeline in PowerPoint you will need to …