Find tons of free chart PowerPoint templates and backgrounds that you can download to customize your charts and presentations in Microsoft PowerPoint. Using these articles under this chart category you can learn how to build charts and customize the look and feel of your charts in Microsoft PowerPoint presentations. Also you can download free chart templates for PowerPoint and Excel.
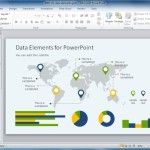
Charts can be an effective method of displaying data before an audience; as it can show a trend for large chunks of data in an easy to grasp visual representation. Moreover, dashboards with multiple sections of data can be another good method for making good use of scarce space on a PowerPoint slide. Fortunately, Slide …
Gaussian Curve (also known as the Gaussian Bell or Bell Curve) is a statistical curve very popular in probability theory. The normal (or Gaussian) distribution is a continuous probability distribution that has a bell-shaped probability density function, known as the Gaussian function or informally as the bell curve. You can learn more about the Gaussian function on Wikipedia …
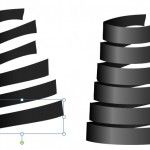
Spiral charts and Spiral diagrams can help to describe processes and concepts in PowerPoint presentations. But designing such diagrams usually require lot of time or we end purchasing premium templates from websites offering PowerPoint templates and diagrams. We can design the spiral diagram in PowerPoint using a very basic approach that includes the use of …
Constructing a flowchart isn’t easy. One should be aware of all the meanings of each flowchart symbol to correctly display a process, as even a single misrepresented symbol can change entire meaning of the process being depicted in the flowchart. This is why we brought you a detailed post about the meaning of each flowchart …
Want to present your bar charts with the help of animations and interesting graphics? We have just the template you need! The Animated Graph Blocks Template for PowerPoint is a set of infographic like slides that provides a fresh approach towards presenting your bar charts. The slide template offers editable sample slides with layouts like …
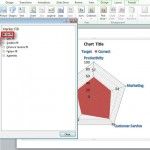
In this tutorial you will learn to make a gap analysis chart. This kind of chart is also known as a spider gap chart, spider chart, and by the name used in PowerPoint—radar chart. The gap analysis chart is great for showing the current and target strengths of something (a company, team, etc.), priorities by …
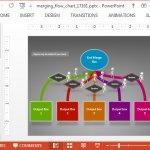
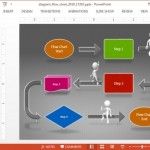
In previous posts we have covered various flowchart PowerPoint templates. These templates are handy for making flowcharts in PowerPoint, with precise symbols, to depict a process. Some of our previously covered flowchart templates were also compiled in a list post of the Best Animated Flowchart PowerPoint Templates. This time we have another animated flowchart template for …
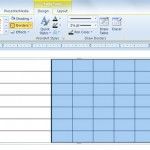
RACI Matrix is a responsibility matrix that stands for Responsible, Accountable, Consulted, Informed and optionally you can use the O for Out of the Loop. If you use the last concept in the RACI Matrix then it is also known as RACIO Matrix. This can be a great lean manufacturing and six sigma tool and …
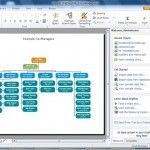
Creating professionally looking board room charts aren’t easy and many applications that offer making such charts can be either hard to use or might not provide a desirable output. OrgPlus is a desktop application that has been designed to automate the creation of organizational charts. With OrgPlus you can import data from an Excel sheet …
Flowcharts represent a process with the aid of symbols and arrows; each of which has a specific meaning. We previously brought you an Ultimate Guide to Making Flowcharts, which provided a range of details and tips for making flow charts. If you want a simple template for making flowcharts in PowerPoint then we have exactly …