Charts

How to Analyze Data Quickly in Excel

See Automatic Preview of Selection

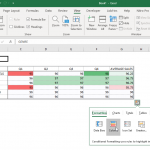
Over the years, Excel has been widely used for collecting, documenting, and analyzing data. It has undergone many changes and improvements over time, adding different features that are relevant to the demands of today. With Big Data as one of the many important things businesses and organizations rely on to make sound plans and decisions, …

How to Easily Create Bubble Charts in Excel to Visualize Your Data

Vibrant Bubble Chart For Excel

Data visualization is important in managing, analyzing, organizing, and displaying all kinds of information. It is through data visualization that you can make more sense of the data that you have, which you may be incapable if you only have tables and worksheets in front of you. In Excel, there are many visualization tools such …

Sparklines in PowerPoint Presentations

In the world of data visualization, sparklines hold a unique place. These tiny graphics, roughly the size of a line of text, pack an enormous amount of data into a small space, providing a clear, concise picture of trends, patterns, and variations. From Edward Tufte’s invention to their application in Microsoft PowerPoint and other platforms, …