High-Quality Charts & Dashboard PowerPoint Templates for Presentations
Charts can be an effective method of displaying data before an audience; as it can show a trend for large chunks of data in an easy to grasp visual representation. Moreover, dashboards with multiple sections of data can be another good method for making good use of scarce space on a PowerPoint slide. Fortunately, Slide Model presents PowerPoint Templates that offer professionally designed (editable) charts and Dashboards for presenting complex data the smart way.
Exclusive Slide Model Dashboard And Chart Templates For Presenting Complex Data The Smart Way
The exclusive Slide Model Dashboard And Chart Templates are a collection of some of the finest business templates for presenting large chunks of complex data in the form of different charts, graphs and sections. With these dashboard templates you can use the professionally designed sample slides for dividing your data in different sections on a single slide, to create a dashboard slide.
1. Blue Dashboard Template for PowerPoint
This template comes with different sample slides which can help you present monthly data in the form of a line chart. You can customize this line chart and also optionally change the chart type to project your statistics in an easy to grasp, unobtrusive layout.

Go to Download Blue Dashboard Template For PowerPoint
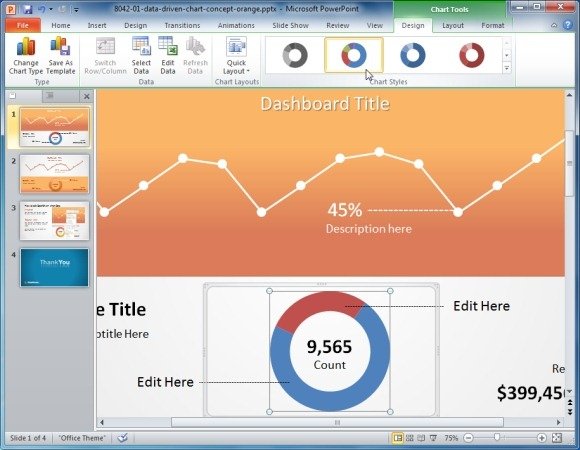
2. Orange Data-Driven Chart Concept For PowerPoint
This is another Dashboard Template by Slide Model, which comes with an orange layout, with editable line and doughnut charts.
Go to Download Orange Data-Driven Chart Concept For PowerPoint
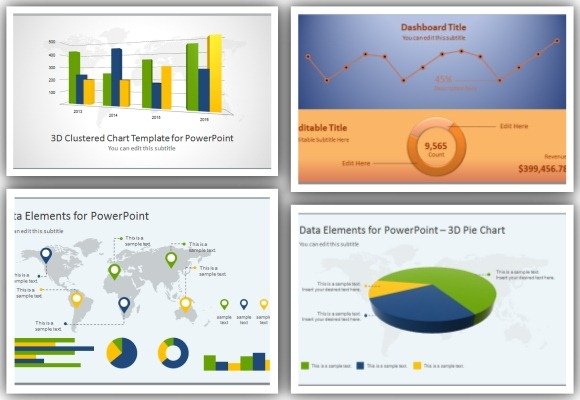
3. 3D Clustered Chart Template for PowerPoint
If you wish to present charts in 3D, then the 3D Clustered Chart Template for PowerPoint can be an ideal resource for presenting your data in the form of 3D bar Charts, with a visually appealing design and spacious sample slides to add relevant information next to your charts (in the available placeholders).

Go to 3D Clustered Chart Template For PowerPoint
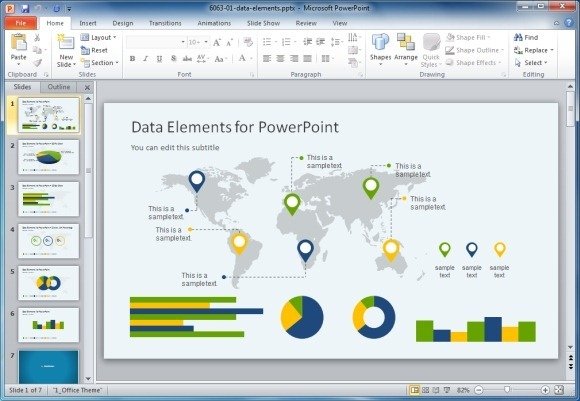
4. Data Elements for PowerPoint Presentations
This is one of the most comprehensive data driven templates that you are ever likely to find. It comes with a good variation of sample slides with charts, dashboards and maps. You can use this template to create anything from presentations about geographical data to reports about financial projections and elaborate data charts.
Go to Data Elements For PowerPoint Presentations
You can download these Dashboard And Chart Templates by signing up for a Slide Model Subscription or by buying templates individually.
Get access to more than 15,000 PowerPoint templates available on SlideModel.com
Go to SlideModel.com