How to Make a Layered Diagram in PowerPoint
There are different ways to represent a layer diagram in PowerPoint, however using shapes is an easy way to add this kind of diagrams. You can use layered diagrams to compare different products or services and a way to represent this kind of diagrams can be using a stack of elements or PowerPoint graphics. For example, we may want to highlight features on a product and for this purpose we can use different slices, where each slice is a feature. Then we can compare two stack of slices and add annotations in the slide design.
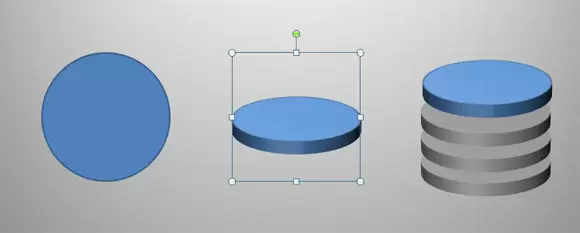
In PowerPoint, you can build this kind of layered diagram from a basic shape like the perfect circle. You can learn how to make a perfect circle in PowerPoint from our previous articles, but once you have inserted a circle you can add perspective to the shape in PowerPoint.
Then, you can copy the shape many times and arrange the order. Make it look like the example above and then change the color for some elements.
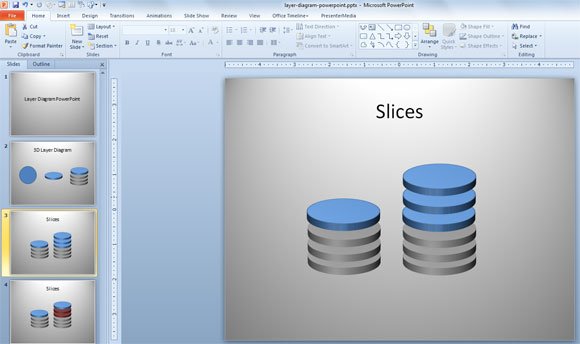
Finally, if you want to compare different stack of slices, you can copy the entire stack (duplicating the shapes again) to make a new set of layers.
Another way to represent layered diagrams is using 2D elements. You can use circles with different diameters or radius.
How to make a 3D Pyramid as a Layered Layer Diagram in PowerPoint
You can also try other visualizations. For example, you may want to use concentric circles and apply a 3D style. Let’s see here some other variants. You can also check our article How to make a pyramid in PowerPoint but this will be differently since it will look like a sectioned pyramid.

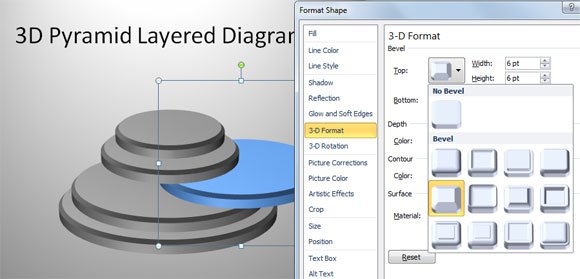
You can move one slice out of the pyramid to highlight a feature. Make it look differently by changing the slice color.

For the slice format, you can change the bevel style, for example to use a different surface. Choose from different presets like Riblet, Convex, Slope, Cool Slant, Art Deco and many other different options available.
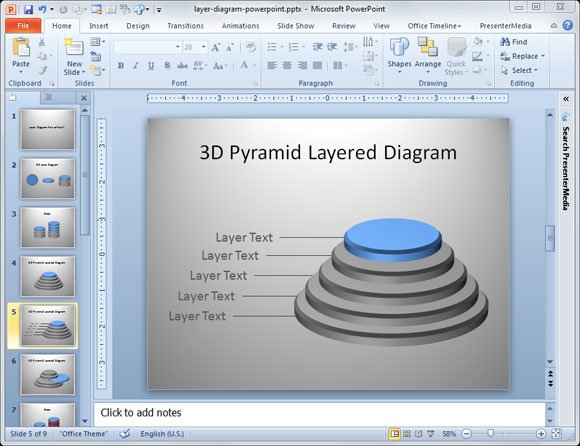
Here is another example using a 3D layered diagram with text labels. You can add lines from each slice and then add a text box.
Finally, you can use these concepts to make awesome 3D PowerPoint presentations just using the shapes feature in PowerPoint and format options, for example to apply a bevel effect on the shapes and 3D styles. You can also apply perspective and other nice styles to your presentation diagrams.