Under the Surface: Iceberg Templates in Presentations

In a world filled with complex concepts and information, presenting them in an understandable way can be a challenge. Iceberg templates for presentations offer a visually captivating and simple solution to this problem. By illustrating the surface information and hinting at the underlying complexity, they provide the perfect metaphor for today’s data-driven society. This article will explore what the Iceberg metaphor represents, why it’s an essential tool in presentations, and how to leverage the use of Iceberg template designs when preparing presentations.
Why Use Iceberg Templates in Presentations?
Iceberg templates engage audiences visually, simplify complex data, and emphasize the hidden factors influencing an outcome. Whether in business, education, or research, the metaphor’s applicability and elegance make it a favorite among presenters.
Iceberg illustrations present data in a two-tier structure. The tip of the iceberg shows the information that’s immediately understandable, while the submerged part reveals the underlying data or factors. From business to science, iceberg illustrations have been widely used to represent hidden complexities.
The metaphor’s visual appeal engages the audience, making complex data more accessible and digestible.
Best Iceberg Templates for PowerPoint & Google Slides
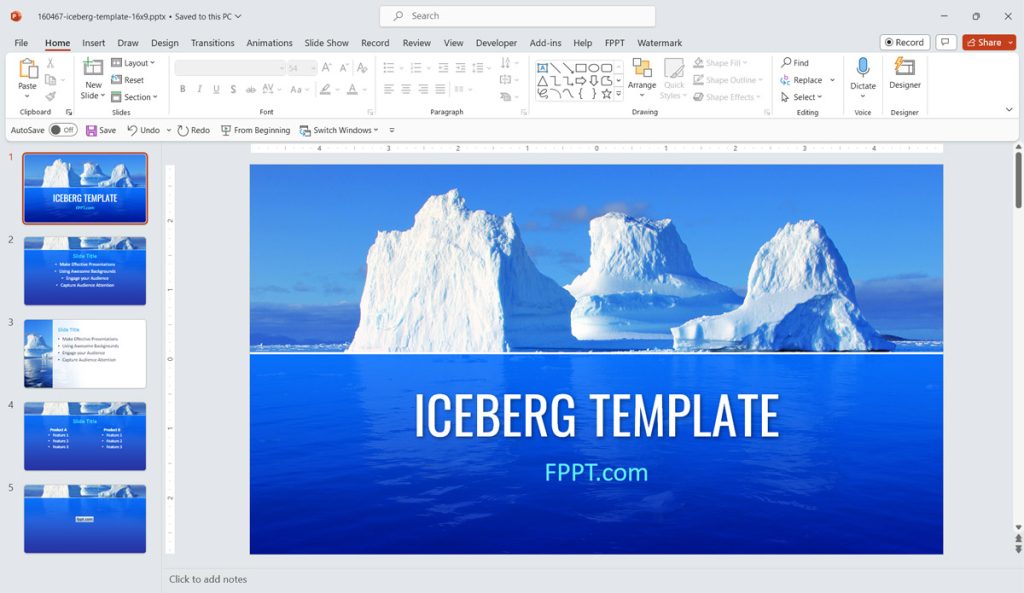
1. Free Iceberg PowerPoint Template
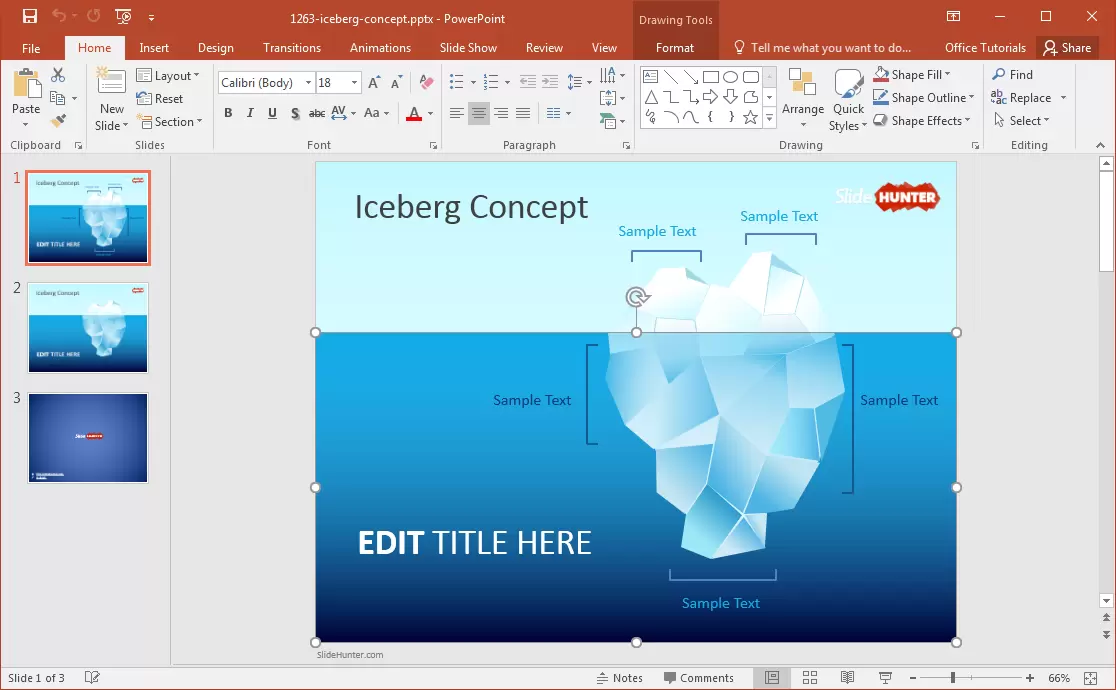
2. Free Tip of the Iceberg PowerPoint Template
This free Tip of the Iceberg template uses shapes in PowerPoint to illustrate the iceberg metaphor. The tip of the iceberg is crafted using geometric shapes, giving it a sharp and professional appearance, while the submerged portion might be represented with more fluid and subtle shapes under the ocean. The design includes text placeholders both around the tip and the submerged part, enabling a clear delineation of concepts or data. Visually appealing and easily customizable, this design helps the presenter to visually articulate the tip of the iceberg theory, where only a small, visible part of a larger structure is revealed. Or in other words: there is more to it than what can be seen or experienced.
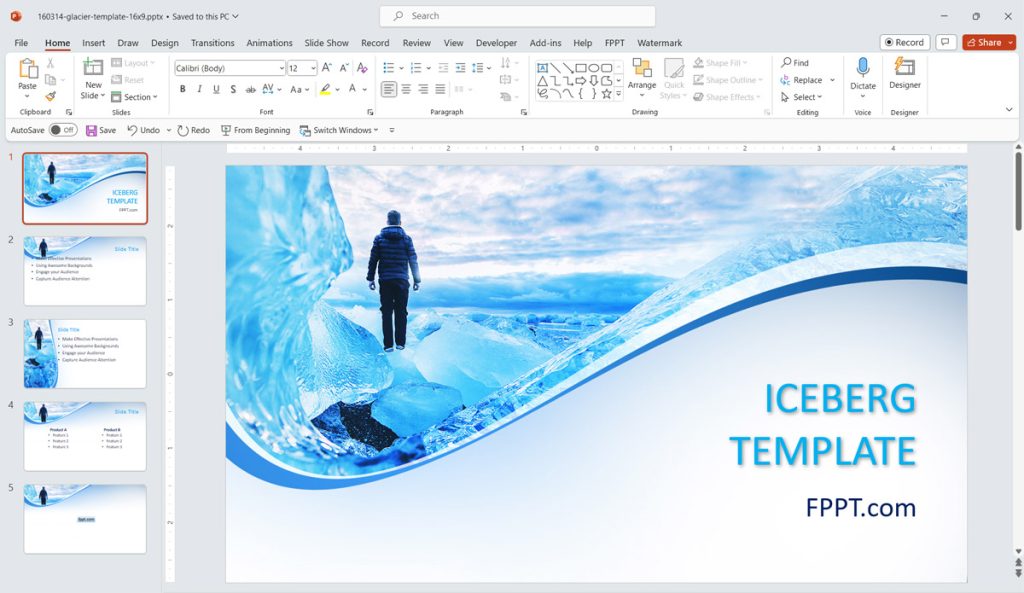
3. Free Glacier PowerPoint Template
This is a free Glacier PPT template design with a cover image featuring a human body on an iceberg. The template contains a cover slide and several internal slides with space to add content.
4. 4-Level Iceberg PowerPoint Template (SlideModel)
The Iceberg PowerPoint template slide design with 4 levels is a powerful visual tool that represents complex data and ideas. The tip of the iceberg, visible above the waterline, symbolizes the readily apparent or surface-level information, while the three submerged levels delineate deeper underlying elements or data. Each level can be color-coded or labeled to distinguish different components, with the possibility of adding icons or brief texts for additional clarity.
The slide design offers clean lines and a minimalist aesthetic, giving a crisp and professional appearance that engages the audience without overwhelming them.
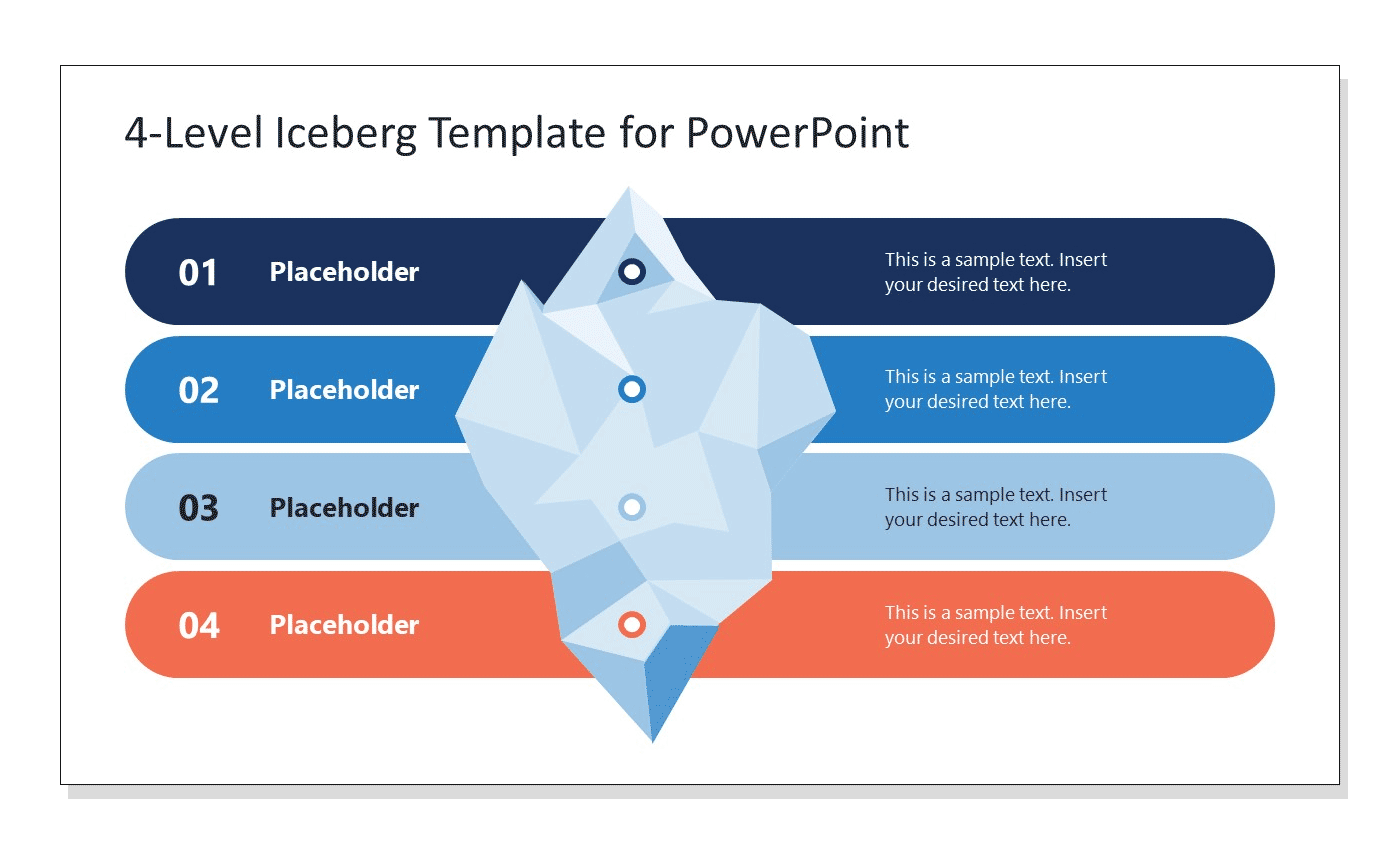
In real-life presentations, this 4-level iceberg template can be used in business or education. For businesses, it can help to show the company’s core values, with the tip representing the mission statement and the submerged levels detailing underlying principles or strategies.
In educational settings, teachers can use it to present a complex theory, starting with the general concept at the tip and breaking down into detailed components in the lower levels.
Healthcare professionals may employ this design to describe a multifaceted medical issue, such as a disease, with the tip showing symptoms and the submerged levels explaining causes, risk factors, and treatments. The ability to tailor the iceberg’s levels to various scenarios makes it an adaptable tool across multiple domains.
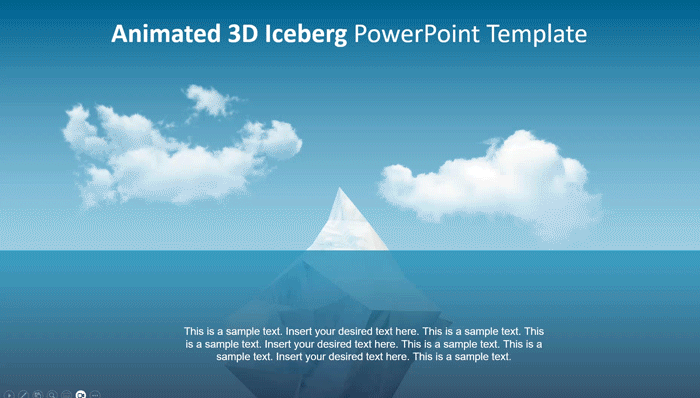
5. Animated 3D Iceberg PowerPoint Template (SlideModel)
The Animated 3D Iceberg PowerPoint Template brings a visually engaging twist to the traditional iceberg metaphor. Featuring a meticulously crafted 3D model of an iceberg, this animated PPT template goes beyond static visuals by incorporating subtle animations that allow the 3D iceberg to rotate. This rotation effect provides a 360-degree view, offering a unique perspective of the iceberg from various angles. It emphasizes the intricate relationship between what’s visible above the water and what’s hidden beneath. The iceberg template for PowerPoint comes with well-positioned placeholders, enabling the end user to effortlessly update the data, text, or concepts they want to present.
This immersive 3D experience lends itself to a wide range of presentation scenarios. For example, in business, it could be used to showcase the different aspects of a product, with the rotating iceberg revealing different features, benefits, or underlying production processes.
In academia, researchers could use the 3D model to present a scientific concept or theory, allowing for a deeper exploration of the subject.
Environmental activists might leverage this animated template to illustrate the hidden dangers of climate change, with the iceberg metaphor standing as a compelling symbol.
The captivating 3D design, coupled with customizable placeholders, makes this template an excellent choice for presenters aiming to leave a lasting impression and convey complex ideas with depth and dynamism.
How to Make your Own Iceberg Illustration?
There are many ways you can incorporate Iceberg illustrations in your presentation slides. If you have access to MidJourney or Stability, you can generate an iceberg illustration with these AI tools.
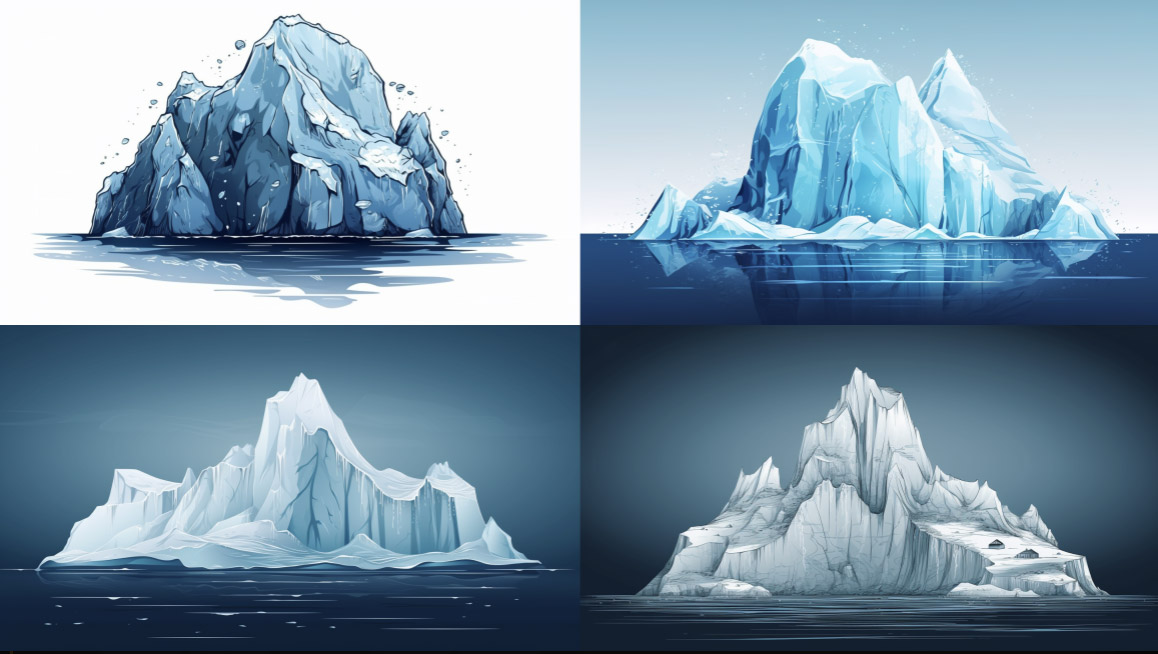
Try using a prompt like this one:
/imagine prompt: iceberg illustration, tip of the iceberg and bottom of the iceberg visible, vector art, blue and white tones, realistic, vector –ar 16:9 –v 5
Once you have a few variations, you can upscale the illustration you like the most.
Then, copy it to PowerPoint as an image. In PowerPoint, it will look like this:
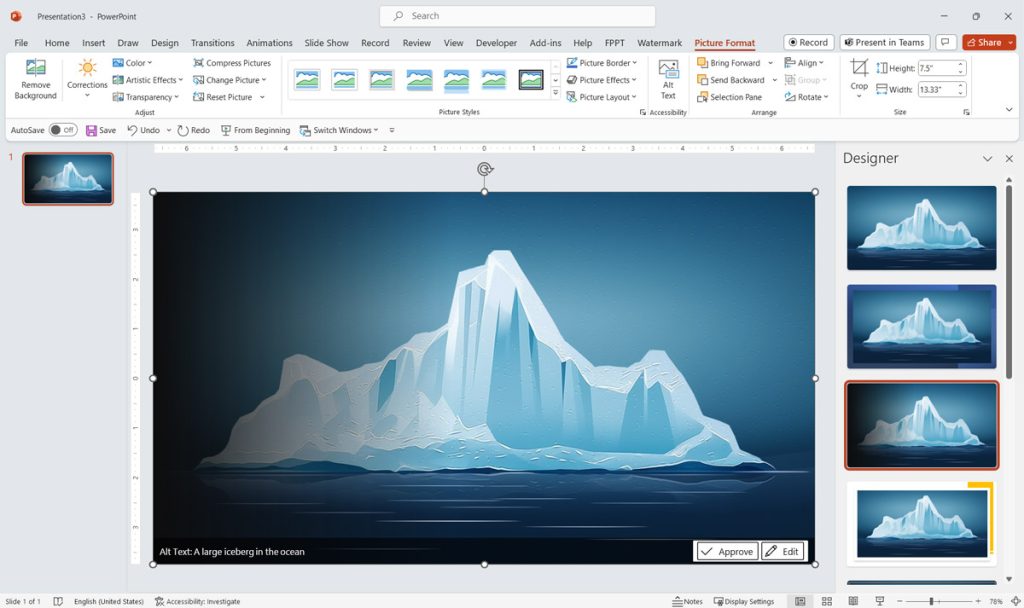
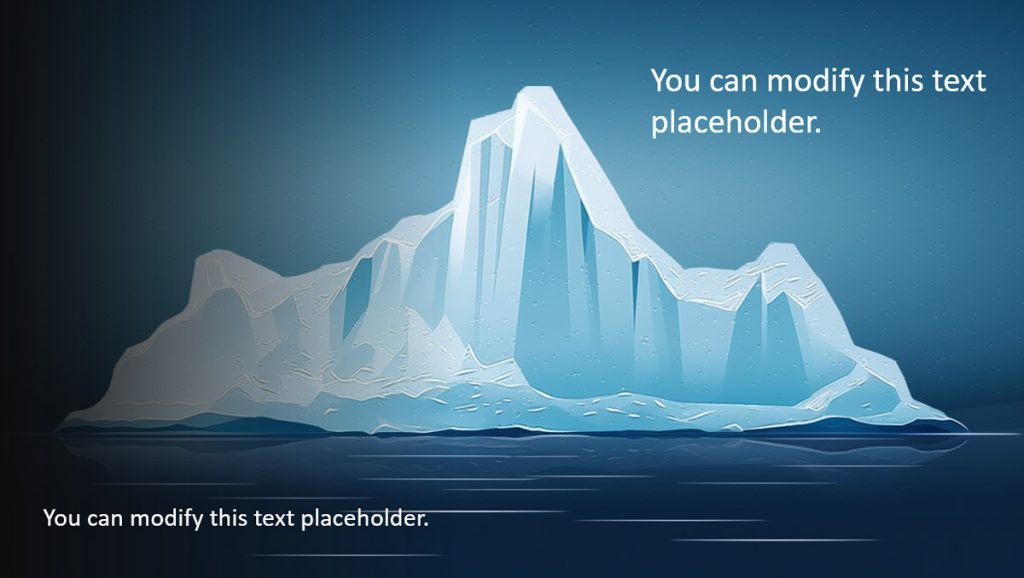
Finally, add some text placeholders (using shapes) to indicate where the tip of the iceberg is, and the hidden part of the iceberg.
Conclusions
Iceberg illustrations serve as an effective tool in presenting data to various audiences. By visually engaging, simplifying complex information, encouraging exploration, and adapting to different presentation needs, they transform the way data is communicated. With thoughtful design, appropriate context, and the right balance, iceberg diagrams can be a powerful addition to any presenter’s toolbox.