How To Use Chart Templates in PowerPoint to Save Time Designing Data Driven Charts

In PowerPoint, you can save your chart design as a chart template for future use. This feature can be really helpful if you want to design custom charts using styles and effects and save it as a template using your corporate visual identity or brand identity. You can also use chart templates to speed up formatting your data while designing presentations in PowerPoint.
The file format used for chart templates is .crtx and it contains settings for colors, axes, grid lines, categories, legends, text, title, and other chart options that you can configure in PowerPoint.
You can design your custom charts in PowerPoint and save them as templates. Then you can apply the same chart template to multiple charts along multiple documents. If you want to avoid changing the chart properties each time you need to make a new chart, then chart templates are for you.
How to Use Chart Templates in Microsoft PowerPoint
It is very useful and simple to use. First, insert a normal Chart in PowerPoint and dismiss the Excel part or where to get the data from. You can test it with dummy data or your real data. But for the sake of this demonstration we will focus on the Chart Design.
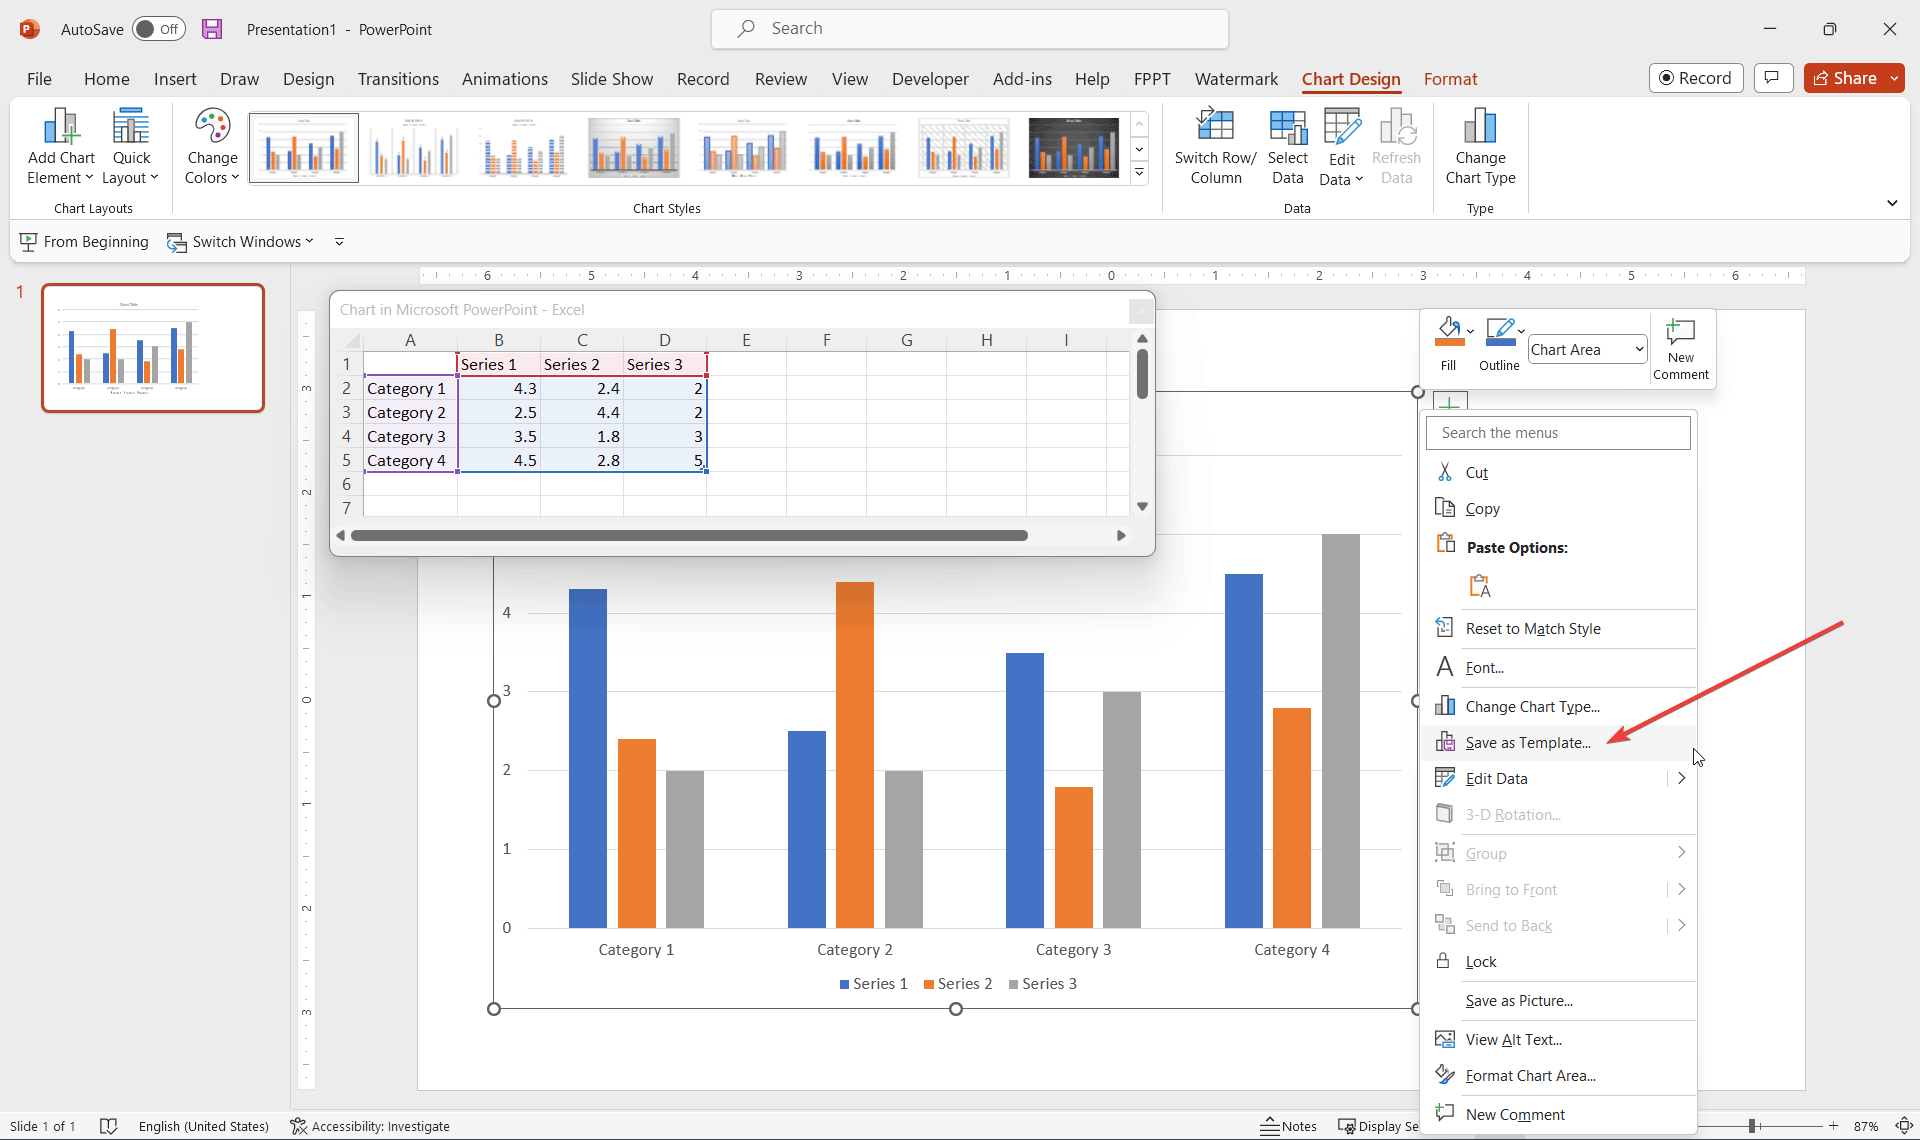
Once the chart is inserted in the PowerPoint slide, right click over the chart and click on the Save As Template option.
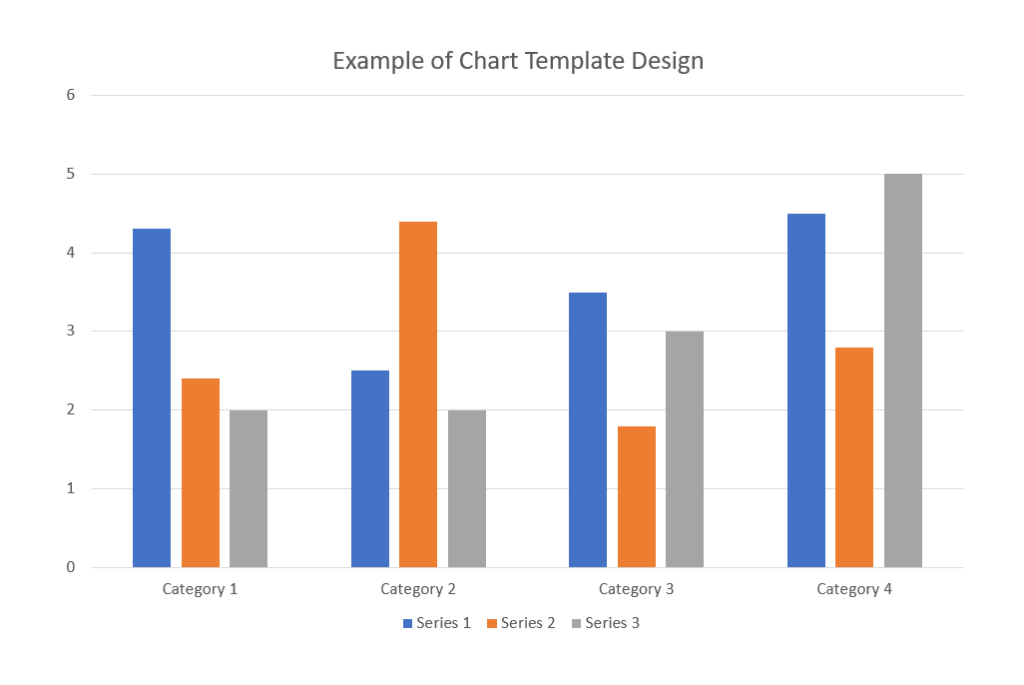
Let’s say that we have the following chart design in PowerPoint. After changing the marker design and line type to smoothed line, then we decided to save it as a template for later usage.
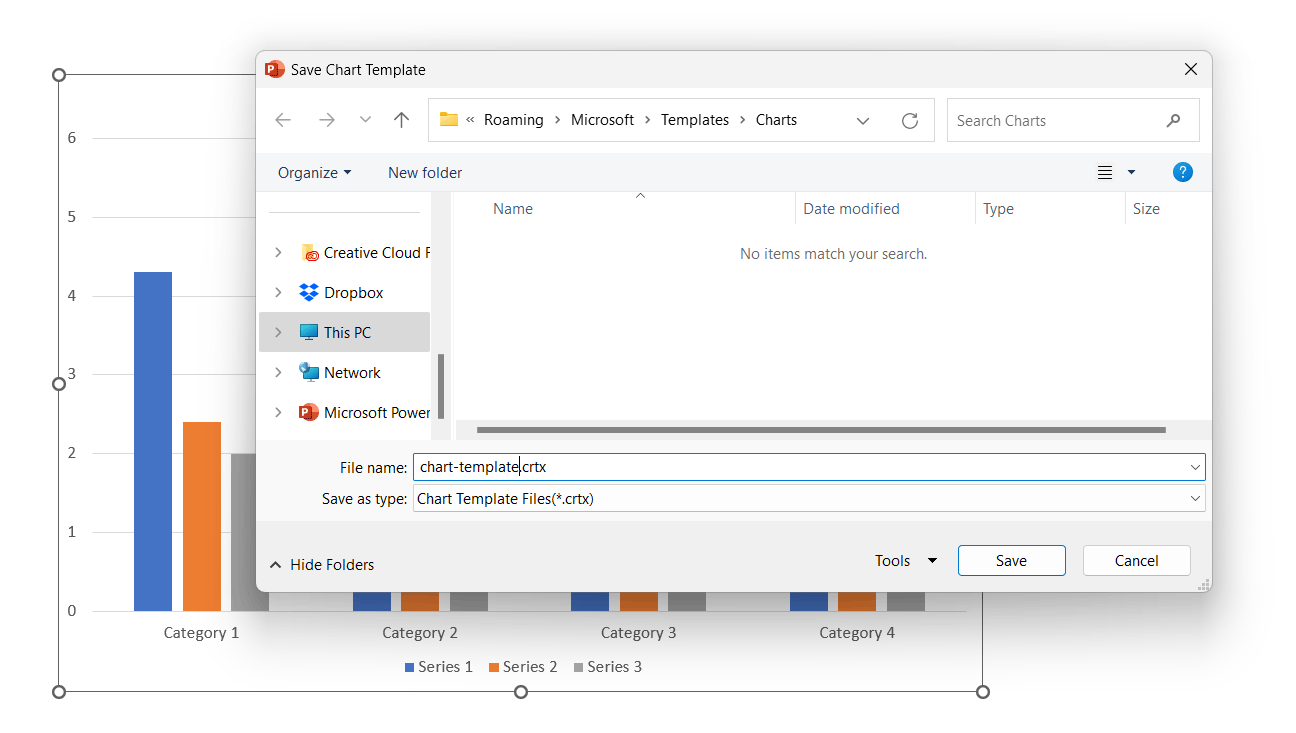
You will be asked to specify a chart template filename and by default it will be saved in the Charts folder, but you can pick any other desired output folder where to save the file. Notice that the extension used is Chart Templates File .crtx.
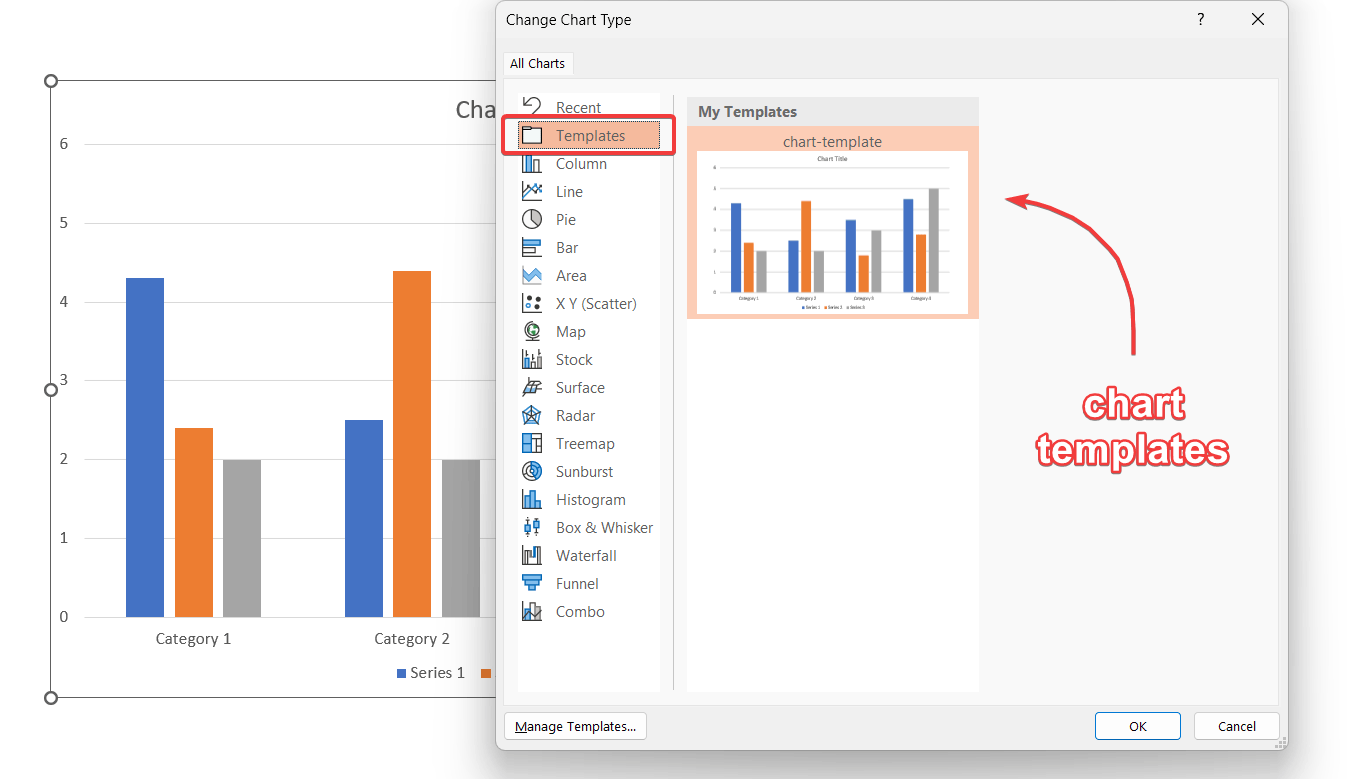
Now, simply click on the template that you want to use and the chart will be inserted.
You can also change an existing chart to use your new template. Just go to the slide and chart that you want to use as a target chart, and then having it selected go to Design tab and click Change Chart Type. You can use the chart templates in Microsoft PowerPoint to apply the same styles and formatting to multiple charts within your PowerPoint presentations.
Possible applications of Chart Templates while designing your presentations
Chart templates in PowerPoint can save you a lot of time when it comes to designing data-driven charts. Here are some possible use cases for creating chart templates in PowerPoint:
- Consistency: If you are creating charts frequently, it’s important to ensure consistency in design and formatting. By using chart templates, you can ensure that all of your charts have a consistent look and feel, which can help to enhance the professional appearance of your presentations.
- Efficiency: Creating charts from scratch can be time-consuming, especially if you need to create multiple charts for the same presentation. By using chart templates, you can save time and increase efficiency by reusing the same design and formatting for multiple charts.
- Branding: If you are creating charts for a company or organization, it’s important to ensure that the charts are consistent with the brand guidelines and visual identity. By using chart templates that are designed to align with the company’s brand, you can ensure that all of your charts are on-brand and visually cohesive.
- Customization: While chart templates provide a consistent design and formatting, they can also be customized to fit specific needs. You can modify chart templates to match your data and adjust the formatting to emphasize important information.
Final conclusions
Chart templates in PowerPoint provide a quick and efficient way to create data-driven charts while maintaining consistency and professionalism. By taking the time to create and customize chart templates, you can save time in the long run and enhance the overall quality of your presentations.
Ver good