Diagrams

How to Make a PEST Diagram in PowerPoint

PEST Analysis is usually represented by a diagram with a central spot and arrows pointing towards the center of a circle. This kind of diagrams and representations are used to show the This tool is widely used to help understand the big picture in certain environments for example Political, Economic Socio-Cultural and Technological environment you are …

Creative Organization Chart Ideas for Presentations

Sometimes, you must design a creative organization chart for your corporate presentations, but you need help finding good ideas. This article will review some innovative organization charts that we can find online with information about the company and corporate structure, from the top CEO to the low-level employees within an organization. Typically, organizational charts are …

5+ Best Flowchart Makers (Free & Non-free tools)

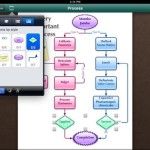
A flowchart is a representation of a process that shows various steps in diagrammatic representation, describing the process’s step-by-step parts. Making flowcharts isn’t the easiest thing to do and even with elaborate options in applications like Microsoft PowerPoint, one can make a mess of things when attempting to make a flow chart. This article, will …