3 Simple Tools for Making And Sharing Charts Online
Last updated on September 29th, 2024
No matter what vocabulary you use to express your statements, but if the information is not presented in an attractive graphical representation, all goes waste. If you talk about the presentation of data in this technologically advanced world, you have numerous options including MS Office for windows, iWork for Mac and many more.
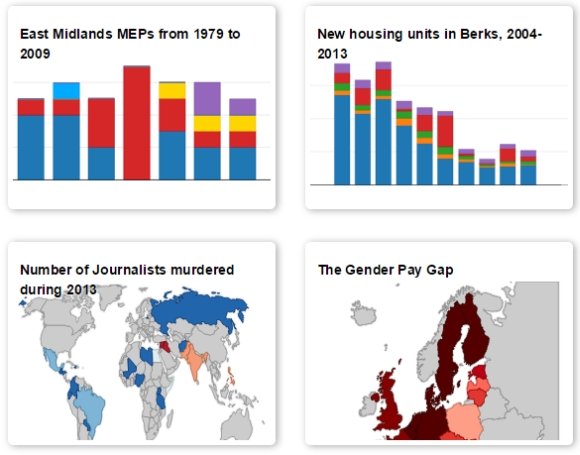
When it comes to making and sharing graphics online, then things are a little different. There are a number of online tools available for presenting data in a better way. Following are the 3 simple tools for making and sharing charts online:
Google Sheets
Google Sheets (formerly Google Spreadsheets) is the most commonly used online tool to create and edit the charts, infographics, etc. Whenever you want to create charts online, then this amazing online tool is the perfect solution as it allows you easy updating at any time.
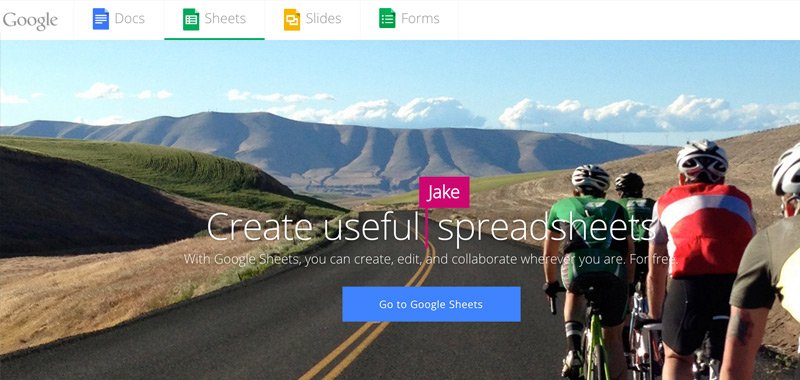
Moreover, using this online software provides you with Google Drive space allowing you to save as many charts and worksheets you want to.
ChartBlocks
With the help of ChartBlocks online app, you can create some really stunning graphs in order to present your data in a more attractive and compelling way. This wonderful online app provides you with the free and premium plans.
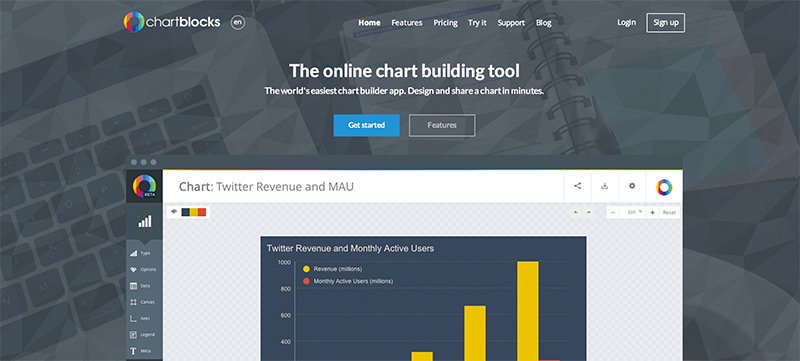
You can use this amazing tool according to your requirements. Moreover, this tool offers you with a wide variety of designs and templates to choose from along with a number of efficient sharing options as well. Here you can find more information on how to use ChartBlocks to make charts for your data dashboard.
Datawrapper
It is considered to be a great online tool for publishing charts and graphs for academic purposes. Although, this app offers you numerous sharing options using your Android or iPhone, but the data editing is limited when using Datawrapper.
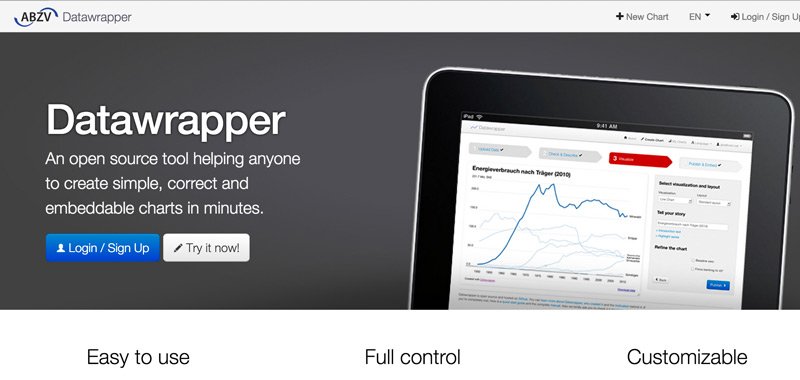
Also, this wonderful online tool provides you with a variety of chart types and designs. It is highly recommended that you should format the data adequately before you paste the shareable data into Datawrapper.
Conclusion
The tools reviewed in this article can help you to create charts online, from very basic charts to advanced data charts. Then, you can export the charts or embed them in a webpage. If you are interested to make charts for your PowerPoint presentations then you can take a screenshot of the chart or choose to export charts as JPG or PNG picture file format, then insert a picture in PowerPoint. Alternatively you can download free data chart templates for PowerPoint.