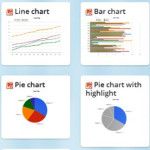
Download free 2D Charts PowerPoint templates including awesome graphics like quadrants, coordinates system and other charts for PowerPoint presentations.
Data visualization is important in managing, analyzing, organizing, and displaying all kinds of information. It is through data visualization that you can make more sense of the data that you have, which you may be incapable if you only have tables and worksheets in front of you. In Excel, there are many visualization tools such …
No matter what vocabulary you use to express your statements, but if the information is not presented in an attractive graphical representation, all goes waste. If you talk about the presentation of data in this technologically advanced world, you have numerous options including MS Office for windows, iWork for Mac and many more.
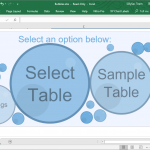
Need help in building an appropriate chart using Microsoft Excel or PowerPoint? How about simply downloading some well made chart templates to get the job done in a snap? Chart Chooser is a website that provides Microsoft PowerPoint and Excel chart templates for free. All you have to do is to sort through the various chart …
Oomfo is a free tool that lets you design awesome 2D and 3D charts for presentations in PowerPoint. With Oomfo you can create nice charts for PowerPoint presentations and training material. Their slogan states the following, Add awesome to your presentation. Now seems to be updated as “Smart Charts for Smart presenters… and for FREE”. Why be …
Advertisement
The Latest FPPT Templates Delivered To Your Inbox
We will send you our curated collections to your email weekly. No spam, promise!