PowerPoint Charts

Spider Gap Analysis in PowerPoint
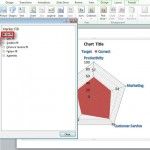
In this tutorial you will learn to make a gap analysis chart. This kind of chart is also known as a spider gap chart, spider chart, and by the name used in PowerPoint—radar chart. The gap analysis chart is great for showing the current and target strengths of something (a company, team, etc.), priorities by …

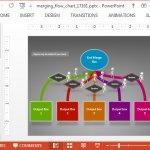
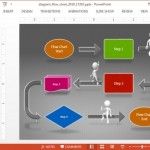
Merging Arrows Animated Flowchart PowerPoint Template

In previous posts we have covered various flowchart PowerPoint templates. These templates are handy for making flowcharts in PowerPoint, with precise symbols, to depict a process. Some of our previously covered flowchart templates were also compiled in a list post of the Best Animated Flowchart PowerPoint Templates. This time we have another animated flowchart template for …

Chart Analysis Tools in PowerPoint

Chart analysis is good to use in mainly showing the distance between high and low points as well as making predictions on increasing and decreasing values over a period. In this tutorial we’ll explore what the Analysis Tools in PowerPoint’s Chart Tools section does. To start you will need a 2D bar or line chart. …