The Evolution of the Web: Example of Visualization Timeline
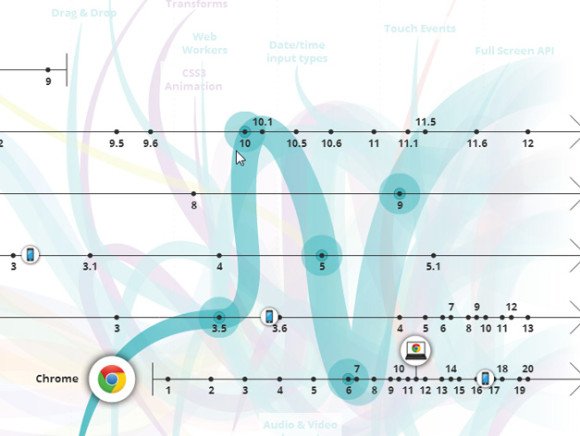
The Evolution of the Web is a project created by Vizzuality, Hyperakt, and members of the Google Chrome team that helps to visualize the main milestones of the World Wide Web using a nice visualization tool (based on a timeline). The Evolution of the Web is the outcome and you can check it on their website. The Evolution of the Web is a visualization tool showing the evolution of web technologies and browsers. It was created using some of the latest web technologies to provide a fresh and distinctive experience (HTML5, CSS3, Canvas, App Engine backed)

With the premise of the web today as a growing universe of interlinked web pages and web apps, teeming with videos, photos, and interactive content, this interactive visualization tool let you browse what were the main milestones since its inception, helping the average user to see the interplay of web technologies and browsers that makes all this possible.
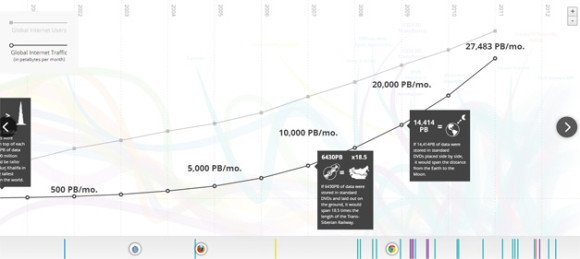
They also built a secondary visualization to show the growth of Internet users and Internet traffic worldwide in a line chart timeline visualization.
The resulting website is a fluid and responsive front-end that brings to life the visual and interaction design. We are not sure if it is related to the Singularity Is Near but definitely we can notice a chaos recently (entropy). This site was declared the site of the day by FWA. It is a nice timeline visualization example or way to visualize complex data using common tools like timelines or line charts. FWA stands for Favorite Website Awards.