How to Add Title to a Chart in PowerPoint
If you need to add a title to a PowerPoint chart using Microsoft PowerPoint then here are a few quick tips that can help you. There are multiple ways to add a title to a PowerPoint Chart using Microsoft Office.
Method #1 – Add a Presentation Slide Title
The easiest way to add a catchy title to a chart that fits into a single PowerPoint slide is by using the normal view with chart and title. This way you can just add the title in the PowerPoint slide (outside the chart area). This can
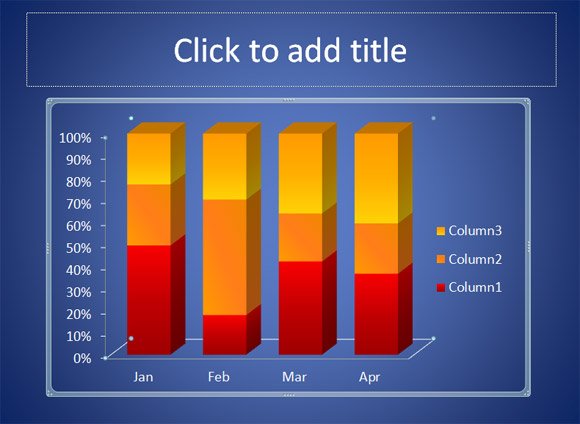
However, if you have multiple charts in the same slide this way may not be affordable by the presenter, so here is another option to change the chart title in PowerPoint. Alternatively, you can learn how to change the title of a PowerPoint presentation slide.
Method #2 – Add a Chart Title
In order to add a chart title under the same chart area you can change the Chart Layouts. This option is available under the Chart Tools -> Design menu. Just make sure to choose a layout with a title on top of the chart design. The following figure can help to understand where to find this chart title layout (ie: Layout 6 in PowerPoint 2010).
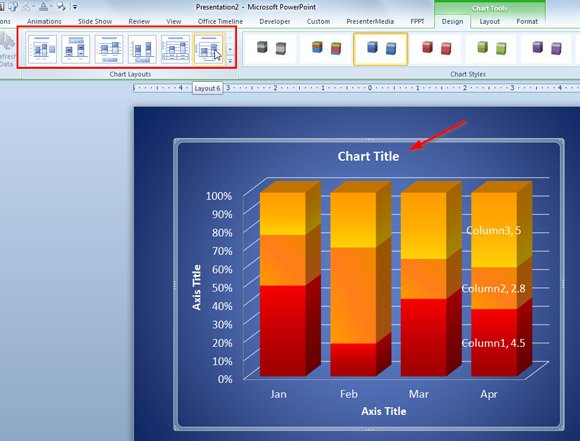
Then, just right click over the title and click Edit Text to edit the chart title.
Alternatively you can try different chart layouts for example to show the legend below the title.
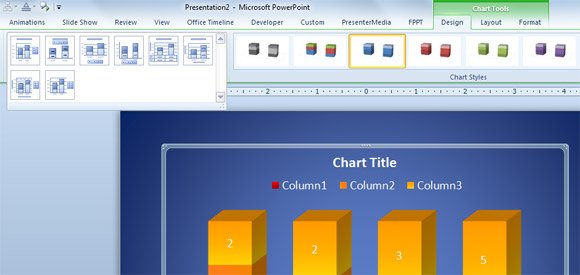
The same ideas in PowerPoint can also be used to add a title in PowerPoint 2013 and 2007.