Analytics

How to Analyze Data Quickly in Excel

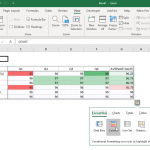
See Automatic Preview of Selection

Over the years, Excel has been widely used for collecting, documenting, and analyzing data. It has undergone many changes and improvements over time, adding different features that are relevant to the demands of today. With Big Data as one of the many important things businesses and organizations rely on to make sound plans and decisions, …

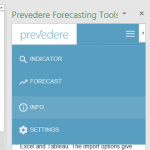
Prevedere Forecasting Tools for Predictive Analytics in Excel

prevedere-excel-taskpane

Prevedere is recognized as one of the best business intelligence software out there. Now, you can have the power of the best intelligence platform right within Microsoft office. This is because Prevedere is now available as an add-in for Microsoft Excel. Prevedere is one of the world’s best and most revolutionary software when it comes …

SnowPlow Event Analytics Platform For Cohort Analysis & Lean Startup

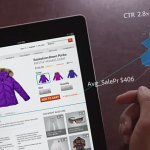
SnowPlow is an open source event analytics platform for collecting and warehousing your data for detailed analysis to boost your sales and to engage your customers more effectively. Companies use SnowPlow to collect event data using various platforms, such as mobile apps, websites and service side systems. SnowPlow collects the respective data which can be …

How to Make a Cohort Analysis Chart in PowerPoint

Cohort Analysis it’s a time-tested segmentation technique used to understand user behavior and recently adopted by authors of Customer Development and Lean Startup methodologies. In Running Lean and Lean Analytics books there are mentions to cohort analysis since this segmentation technique can help entrepreneurs to understand the behavior of early adopters of your product or startup …