Download free analysis templates for presentations including slide designs that you can use for diverse analysis in PowerPoint, for example free funnel analysis PowerPoint templates, root cause analysis using cause and effect diagrams as well as other fishbone analysis PowerPoint presentation slide designs.
When evaluating the various internal and external factors which may influence a business venture, one of the most basic evaluation models used is the SWOT analysis. In this post we will provide you with a complete overview of how to create a SWOT Analysis using some very simple methods.
One of the most basic and commonly used business concepts is the SWOT analysis. This is a simple analysis of the strengths, weaknesses, opportunities and threats for an organization. In a previous post we explained how to make a SWOT analysis; this time we have compiled a list of the Best SWOT PowerPoint Templates. This …
A SWOT analysis is one of the most common type of evaluations used to measure a company’s strengths and opportunities against weaknesses and threats which might affect short-term and long-term prospects. In a previous post we extensively covered what a SWOT analysis is and we have also reviewed some of the best SWOT analysis PPT templates …
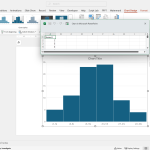
Using Excel and the free Analysis Toolpak add-in for Excel, you can create useful histograms for your spreadsheets, but also use the resulting image to copy and paste the Histogram in PowerPoint presentations. Here we will show you how to make histogram charts for PowerPoint using Excel. Here we will show you how to create …
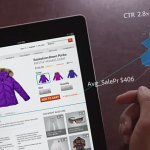
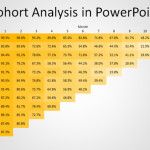
Cohort analysis is becoming an essential form of data analysis for a variety of industries and sectors, including e-commerce platforms. There are a number of Cohort Analysis tools which can enable you to perform a cohort analysis effectively. Data derived after performing a cohort analysis can be particularly useful for formulating new business & marketing …
Cohort Analysis it’s a time-tested segmentation technique used to understand user behavior and recently adopted by authors of Customer Development and Lean Startup methodologies. In Running Lean and Lean Analytics books there are mentions to cohort analysis since this segmentation technique can help entrepreneurs to understand the behavior of early adopters of your product or startup …
A fishbone diagram is an analysis tool to systematically understand effects and the causes that create those effects in business situations. You can draw your own Fishbone diagram or download ready-made PowerPoint templates in PowerPoint. The fish bone diagram looks like the skeleton of a fish, and that’s why its name is the fishbone diagram. …
Developing a product that fulfills customer needs and delights them requires carefully analyzing various customer needs and market demand for features that might give your product an edge. The Kano model presents a framework for analyzing and catering to customer demands by analyzing different essential aspects of a product.
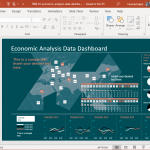
Presenting data analysis for a baseline, midline or endline assessment, by unpacking big data or for information gathered from a third-party source requires a particular type of slide deck. You might need to present charts, tables and infographics to show trends and forecasts. The Animated Data Analysis PowerPoint Template with its uniquely designed slides makes …
Every major project requires a feasibility analysis to be performed before time and money is committed to the project. This ensures that all possible variables are assessed to determine the viability of the project. If you’re looking to conduct a feasibility analysis or need the right presentation template for it, see the below guide to …