Free Six Sigma Fishbone Diagram Templates for Word
A fishbone diagram is an analysis tool to systematically understand effects and the causes that create those effects in business situations. You can draw your own Fishbone diagram or download ready-made PowerPoint templates in PowerPoint. The fish bone diagram looks like the skeleton of a fish, and that’s why its name is the fishbone diagram.

The diagram was initially suggested by Dr. Kaoru Ishikawa, a Japanese quality control statistician who invented the fishbone diagram. It is also referred to as the Ishikawa diagram or cause-and-effect diagram. A fishbone diagram is of great value in systematically assisting teams in categorizing the many potential causes of problems or issues.
It helps identify root causes, and you can use this diagram in your PowerPoint presentations to model cause-and-effect situations.
- Study all the possible reasons why a process is having difficulties, problems, or breakdowns in the initial stages of the process.
- Need to identify areas for data collection
- The team needs to study a problem to determine the root cause
- To study why a process is not performing properly and/or producing the expected results
How to make a Fishbone diagram from scratch
- Draw a fishbone diagram
- List the problem/issue to be studied in the head of the fish
- Label each bone of the fish. The major categories typically used are:
- The 6 M’s: Methods, Machines, Materials, Manpower, Measurement, Management
- The 4 P’s: Place, Procedure, People, Policies
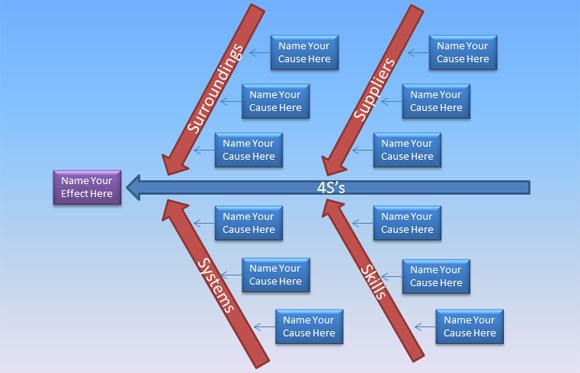
- The 4 S’s: Surroundings, Suppliers, Systems, Skills
- Repeat this procedure with each factor under the category to produce sub-factors. Continue asking, “Why is this happening?” and put additional segments each factor and subsequently under each sub-factor.
- Continue until you no longer get useful information as you ask, “Why is that happening?”
- Analyze the results of the fishbone after team members agree that an adequate amount of detail has been provided under each major category. Do this by looking for those items that appear in more than one category. These become the ‘most likely causes”.
- For those items identified as the “most likely causes”, the team should reach consensus on listing those items in priority order with the first item being the most probable” cause.
If you are looking for editable fishbone templates for PowerPoint then you can consider to download the templates available at SlideModel.com like the following example.
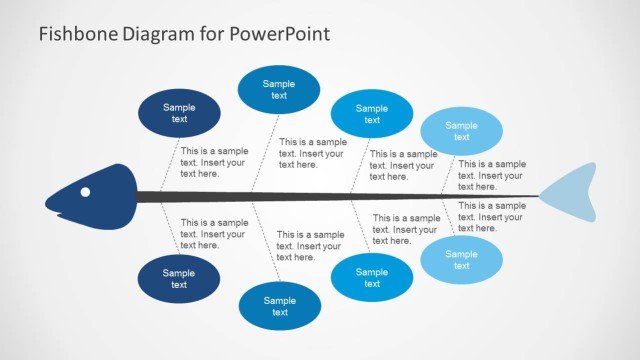
To create a fishbone diagram, you can make it from scratch or you can use fishbone diagram templates. In this other article, we present a collection of free and paid Fishbone Diagram Templates that you can use to prepare presentations with fishbone diagrams.
2 comments on “Free Six Sigma Fishbone Diagram Templates for Word”
Comments are closed.