

Advertisement
LibreOffice Impress 3.5
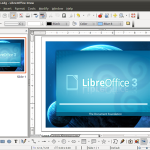
LibreOffice Impress 3.5 was introduced recently with the new release with lot of new features and enhanced PowerPoint import functionality. LibreOffice Impress is a truly outstanding tool for creating effective multimedia presentations and allow to work with Microsoft PowerPoint files as well as other presentation file format. Your Impress presentations can be enhanced with 2D …