How to Make a Layered Wheel Diagram Template in PowerPoint
Last updated on April 29th, 2024
This article will explain how to design a simple but useful wheel diagram with multiple layers. You can use this kind of PowerPoint diagrams as a visualization tool for your presentation reports or dashboards, but also to combine the design with other similar visualizations like steering wheel.

Let’s see how to make a layered wheel diagram template for PowerPoint presentations.
To make a layered wheel diagram we can first start drawing a few circles for each level of information that we want to show using the shape tools in PowerPoint.
You can separate the circle in different segments, for example divide the circle by three. This way you have 3×3 level of information.

Duplicate the circle many times (3 times for example) and then modify the yellow diamond to match the design above.
This looks like a pie chart in PowerPoint but created with simple circle shapes. You can learn how to change a circle and convert it to a semicircle in PowerPoint using this simple technique. You can move to front or back in order to make it look like in the picture, and change the color for the three pieces of information.
Next, add a simple shadow effect to the circle on the background.
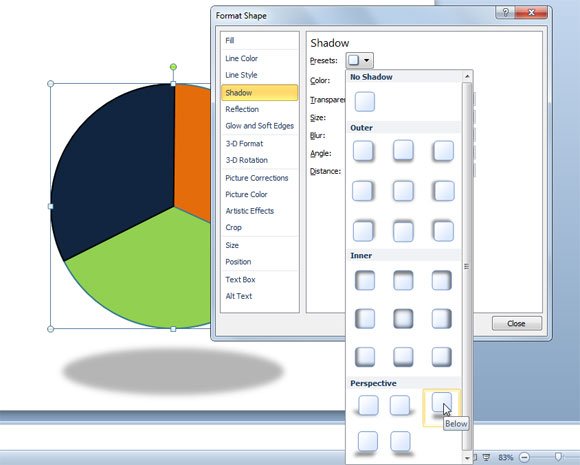
To add the shadow, you can right click on the shape and then access Format Shape options. Now look for Shadow tab and click on Presets. Then look for Perspective Shadow styles, and find the Below style.
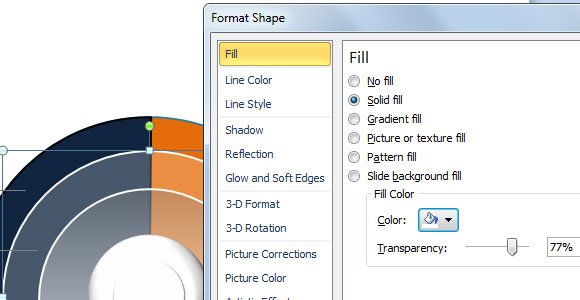
Now, you can duplicate the big circle many times for inner levels of information. In this case we have used a gradient fill with a transparency level.
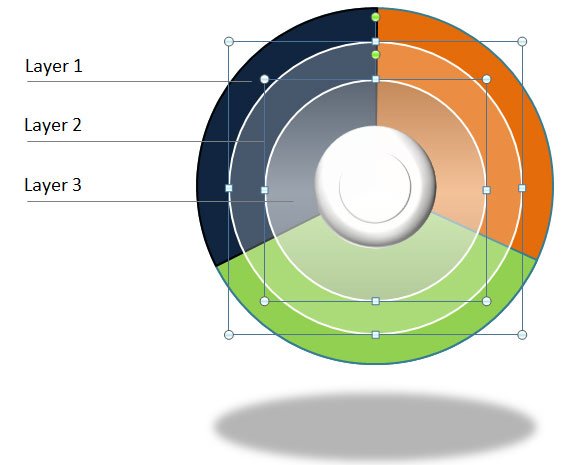
And here is the final result for a wheel diagram in PowerPoint that you can use in your PowerPoint templates.
We have seen how to make a wheel chart in PowerPoint. If you want to download other free wheel PPT templates and diagrams for your presentations, you may consider to browse our free collection of PPT diagrams and charts for businesses.