Create Simulations and Mind Maps with Loopy
These days, people’s attention spans are getting shorter and shorter. Add this to the fact that we are all bombarded by many things around us that vie for our attention. We also easily get distracted by one thing that’s always with us–our mobile phones. This is why, more than ever, we need to come up with better presentations such as simulations and mind maps.
Easily Create Looped Simulations
Simulations and mind maps are visual tools that allow you to more effectively tell a story in a way that captures the attention of your audience. This is particularly helpful in presentations because it allows you to be brief and concise in your slides while still easily getting your message across to your audience.
However, if you don’t have much of a background in PowerPoint, much more in animations and graphics, it would be quite difficult to create simulations and mind maps. Often, you would hire help from professionals or you would need to spend more time navigating through the process to produce one that looks passable, if not professional. Well, with this hack, we will help you create interactive simulations and mind maps with Loopy.
Free Tool for Visualization and Mind Maps
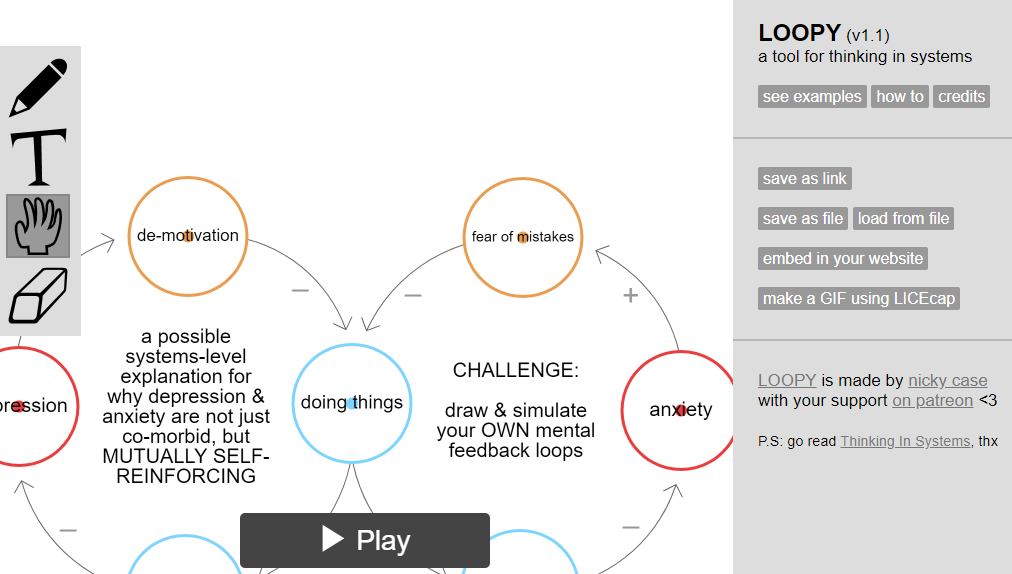
Loopy is a free tool that allows you to create interactive simulations online. System and feedback loops are often hard to visualize, so this tool can help make things so much easier for you–and your audience.
Whether it’s about business, economic, environmental, or any topic under the sun, you can use this simulation and mind mapping tool to help you out. Alternatively, you can create your own mind maps in PowerPoint.
With Loopy, you don’t need to subscribe to a service, download a complicated application or get classes to learn new software. Creating visuals with Loopy is simple and fuss-free since the interface is pretty much straightforward and very user-friendly.
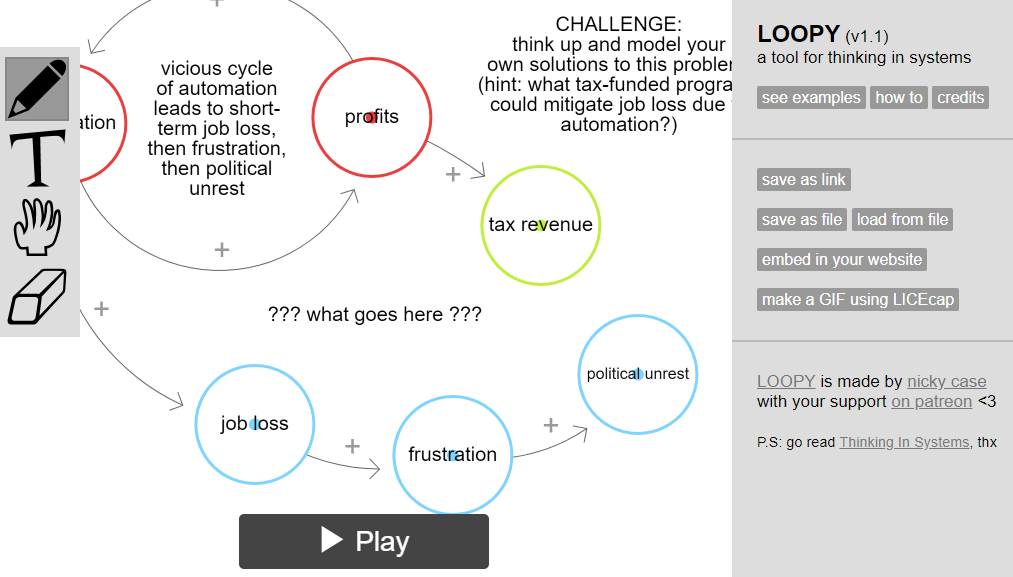
Through your browser, Loopy allows you to draw visuals with your mouse. If you’re familiar with MS Paint, it’s pretty much like that, so it’s simple and anyone can do it. Within just a few seconds, you can create a complicated simulation loop with input and output nodes with your rough sketch. You don’t even have to worry about your visual looking amateurish, though, because Loopy’s technology allows you to create one that looks professional each time.
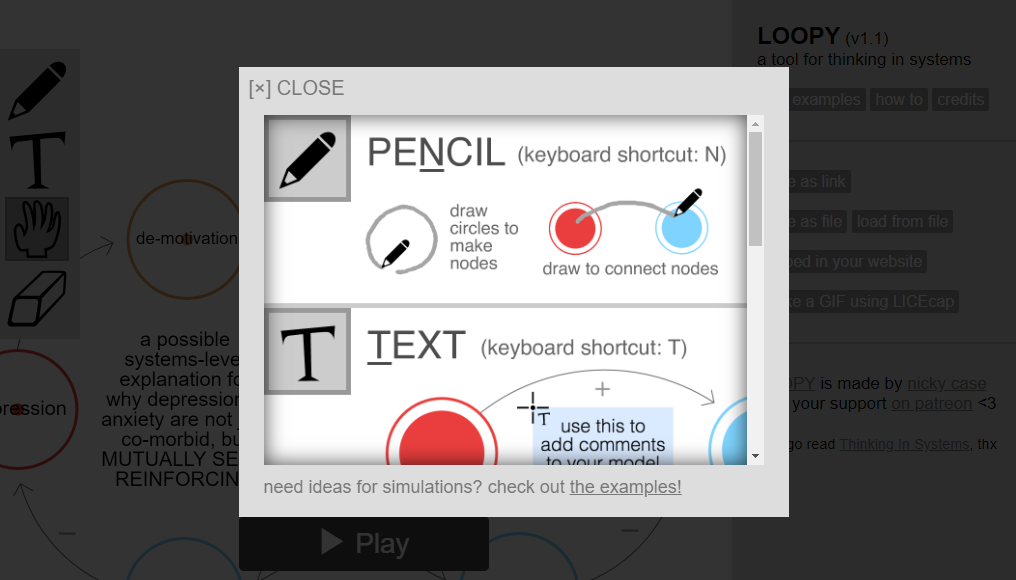
So, now, once you’ve drawn your input and output nodes, you can label each one and connect with a “+” or “-” sign to show a relationship. There should also be lines connecting the two nodes. Then, one any side or on top or bottom, you can insert text to briefly describe your visual.
You can also move over any of the nodes to increase or decrease the number of arrows through your loop. You can do this by clicking on any node. This can also be done on the fly, whenever you feel the need to adjust your loop. This simulation and graph tool can be used for a variety of simulation models, including technology, environment, economics, business, politics, culture, psychology. If you were looking for ways to enhance your visual graphics in a presentation, this tool can be helpful.
You can try it out for yourself for business presentations, school projects, or just for personal fun.