
Advertisement
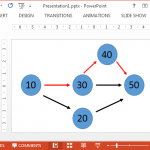
Animated Graph Template for PowerPoint

When making graphs for presentations one of the biggest issues a presenter has to deal with is to make the data easy to grasp and also to ensure that the audience can be kept attentive. Slides with graphs can hold important data but are also most likely to be ignored by the audience. You can …