Office

How to Easily Create Bubble Charts in Excel to Visualize Your Data
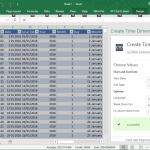
Vibrant Bubble Chart For Excel

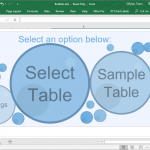
Data visualization is important in managing, analyzing, organizing, and displaying all kinds of information. It is through data visualization that you can make more sense of the data that you have, which you may be incapable if you only have tables and worksheets in front of you. In Excel, there are many visualization tools such …

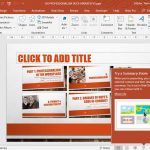
Best Methods for Using PowerPoint Zoom

Summary Zoom Slide in PowerPoint

In the recent years, PowerPoint continues to be at the forefront of presentations because of its steady rollouts of features and functionalities. Recently, PowerPoint has rolled out tools that can make the application more seamless across devices, encouraging creativity and collaboration with ease. One of the most popular tools it has unveiled is the Zoom …

Make Your Excel Tasks Easy with ASAP Utilities Add-in

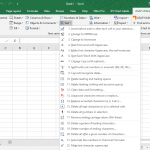
Text Functions By ASAP Utilities

For beginners and those who are quite unfamiliar, Microsoft Excel can seem daunting. After all, you’re faced with grids and grids of cells, and then there’s the challenge of making sure you input the right formula to come up with the right answers. Excel can really be quite technical, but once you get the hang …

How to Create Radial Bar Charts in Excel

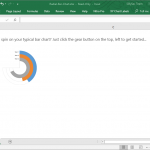
Get Started With Radial Bar Charts For Excel

These days, there are many fun, vibrant and creative ways to visualize your data. Beyond the usual bar, line, and pie charts, there are many add-ins that can help you spruce up your data and related reports. One of these is the Radial Bar Chart add-in for Excel.