Advertisement
Use a Map from Google Maps in PowerPoint Presentations
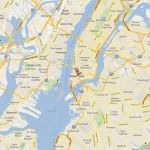
If you need to use maps in your presentations then you can generate them in Google Maps and here we will explain you how to extract maps from Google Maps and use them in PowerPoint. This is great to extract and insert Google Maps’ maps into PowerPoint presentations or maps PowerPoint templates. Here we will …