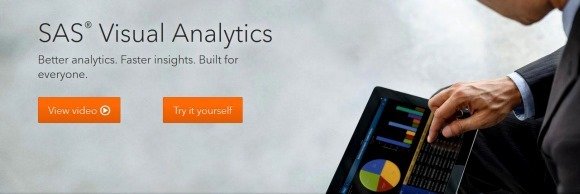
SAS Visual Analytics: Create Amazing Interactive Reports From Corporate Data
SAS Visual Analytics is a powerful business intelligence solution with visualization features that are easy enough to be used by anyone, be it an advanced computer user like an IT pro or a novice computer user doing desk work. Moreover, the data visualization provided by SAS Visual Analytics is not basic but rather it weaves an intricate web of information that presents information about existing trends, as well as how things may materialize in future, based on the available data.
Create Custom Data Visualizations from Your Data and Share Them With Anyone
From a simple drag and drop interface, users can create custom reports and share them across the web or even on mobile devices. Furthermore, you can make use of the cloud based secure data hosting to save your data online and to be ensured of the corporate privacy that is essential to maintain for your corporate data.
How To Use SAS Visual Analytics?
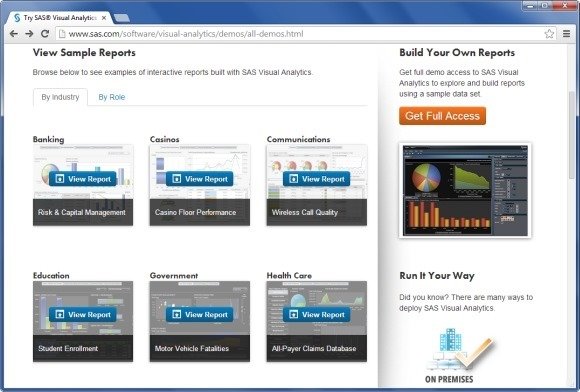
To get started, go to SAS.com/visualanalytics and check out the demo reports or Get Full Access by signing up to test drive the service and to determine its utility for your business. SAS can be deployed through three different methods, including on premises, via the cloud or by using the SAS cloud for hosting your data.
If you choose to see the online demo, you can check out sample reports either by Industry (Banking, Education, Government, etc) or by Role (Customer, Merchandising, Operations, Marketing, etc).
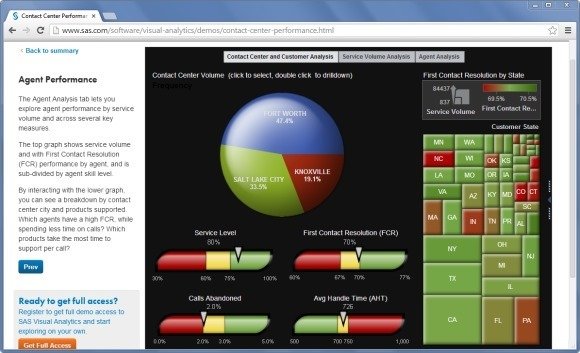
Below is a sample interactive report generated using SAS Visual Analytics which shows an analysis of agent performance in a contact center.
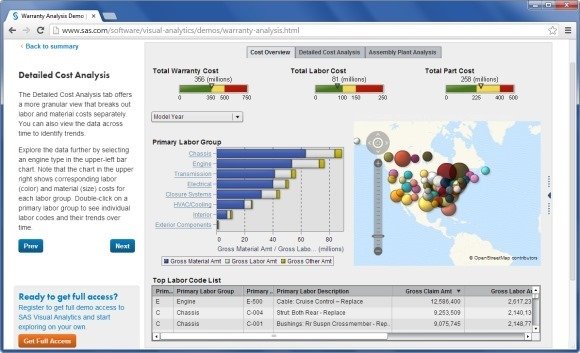
Similarly, the below interactive report displays a cost overview of aggregate warranty costs. The point is that you can generate an endless variety of reports based on your data to visualize existing and projected trends to determine the best course of action which may be suitable for your business.
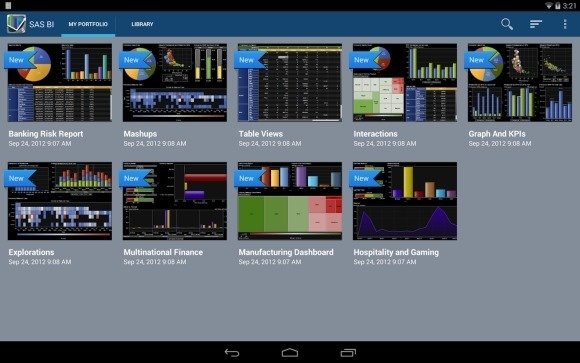
Mobile Apps for iPad And Android
SAS Visual Analytics also has mobile apps for Android and iPad devices, to help users take their business reports and dashboards with them on the go.
To find out more about SAS Visual Analytics, visit the link given below.
Go to SAS Visual Analytics