Learn how to make scientific slide designs in PowerPoint using data analysis tools and visualization ideas that you can use to make effective PowerPoint presentations.
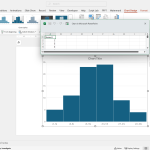
Using Excel and the free Analysis Toolpak add-in for Excel, you can create useful histograms for your spreadsheets, but also use the resulting image to copy and paste the Histogram in PowerPoint presentations. Here we will show you how to make histogram charts for PowerPoint using Excel. Here we will show you how to create …
Cohort analysis is becoming an essential form of data analysis for a variety of industries and sectors, including e-commerce platforms. There are a number of Cohort Analysis tools which can enable you to perform a cohort analysis effectively. Data derived after performing a cohort analysis can be particularly useful for formulating new business & marketing …
Presenting data analysis for a baseline, midline or endline assessment, by unpacking big data or for information gathered from a third-party source requires a particular type of slide deck. You might need to present charts, tables and infographics to show trends and forecasts. The Animated Data Analysis PowerPoint Template with its uniquely designed slides makes …
When you apply for a job it is likely that there are dozens if not hundreds of other candidates who have applied for the same position. You need a resume that is easy to scan for the HR department or AI resume screening algorithm to ensure your skills and achievements are highlighted in a matter …
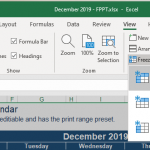
When you’re working with spreadsheets, there can be a lot of data that your worksheet would take up many cells. It can be easy to get lost, if this is the case. You may have a hard time recognizing what row or column the cell you’re viewing belongs to. And this is where Microsoft Excel’s …
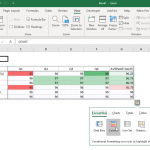
Chart analysis is good to use in mainly showing the distance between high and low points as well as making predictions on increasing and decreasing values over a period. In this tutorial we’ll explore what the Analysis Tools in PowerPoint’s Chart Tools section does. To start you will need a 2D bar or line chart. …
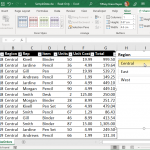
Using a Slicer in Excel is one of the best ways for you to filter your data. This is especially true if you have a large and complex data set. If you want to figure out a single category or view a specific data set under specific conditions, then a slicer can help you with …
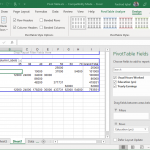
One of the most powerful and most widely used features of Excel is the PivotTable. A PivotTable allows you to extract the data that you need from a large, complex, and detailed data set. Many may find themselves intimidated by pivot tables. However, once you get the hang of it, you will see how easy …
Many things in this world can be chaotic and unpredictable. This is why systems and strategies are in place. It helps to make sense of the chaos and bring in order. This next premium animated PowerPoint template will take a look at chaos and order. This will let you see how the best strategies for …
Over the years, Excel has been widely used for collecting, documenting, and analyzing data. It has undergone many changes and improvements over time, adding different features that are relevant to the demands of today. With Big Data as one of the many important things businesses and organizations rely on to make sound plans and decisions, …