Polychart: Create Awesome Charts For PowerPoint Using Your Own Data
Data visualization tools are one of the most effective ways of conveying long and otherwise daunting information to your audience. Charts and graphs are common ways of displaying information and unlike text and figures, they do not scare the audience.
Polychart is a free web service that lets you easily create dashboards and charts from your existing database. It conveniently connects directly to where you store your data and works in browsers and on tablets so you can create charts and diagrams anywhere you are. You can also export your charts to PowerPoint, PDF and image formats.
Features
Its features include:
- Automated Reporting – Unlike manual reports that easily become outdated overtime, Polychart keeps your data updated and catches mistakes as they happen.
- Visual Data Analysis – Polychart allows you to closely examine all your data to understand the “why” behind what you see. You can easily analyze the data that you have instead of having to resort to other services to do the analysis for you.
- Flexible Data Sources – Polychart lets you directly connect to multiple data sources, whether inside or outside your organization, so you can present data in centralized and cohesive formats.
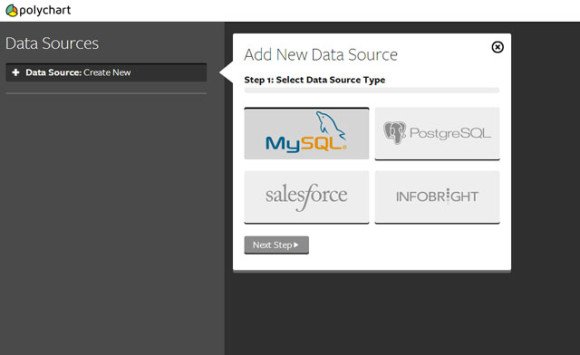
Polychart currently supports MySQL, PostgreSQL, Salesforce, and INFOBRIGHT. It is in beta and free to use for websites. It can be deployed on your organization’s servers and also offers OEM.
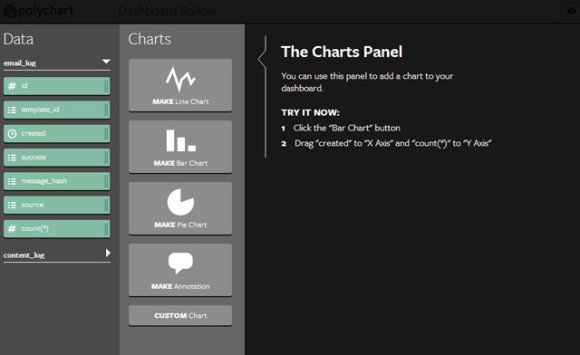
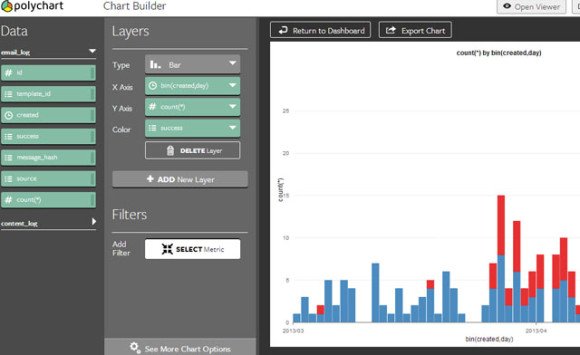
Polychart lets you create charts and graphs by simply dragging and dropping information. You can connect your database and select which fields you want to visualize. You can also customize the type of chart you want to use (Bar, Line, Scatter, Area, Tile and Spline) and the individual elements that make it up, to make your information visual and accurate.
Your final data or chart visualization can be easily exported to a PDF, PowerPoint, image (PNG) or even vector (SVG) file.
You can sign up for this free service at the polychart.com.