Make Amazing Data Charts With Microsoft SandDance
Data visualization can make everything look better and more understandable. From simple stats to comprehensive analysis, visualization tools such as charts and graphs can greatly help you gain better insight into your business, projects, surveys, and reports. With this in mind, Microsoft has developed SandDance, a free data visualization app that helps you create stunning and insightful visuals.
With SandDance, you can collect large amounts of data and make sense of it in a way that is free and easily accessible. The app also allows you to further explore your data for more thorough analysis, which you can’t easily do with other visualization tools.
Visually Explore Sets of Data with SandDance
Using an intuitive touch-based interface, Sand Dance can help you dynamically navigate through dense and complex data. It was developed by Microsoft Research as a way for everyone to create custom and dynamic visual inputs through Power BI. This allows users to stunningly create stories using analytic data with the help of dynamic visuals.
Microsoft makes it easy for everyone to access SandDance and use it, so it is also available as a stand-alone web-based tool. Ease of use and portability into other platforms is very important to them, so SandDance revolves around a free model. There are no subscriptions, signups, downloads, or logins required.
Make Data Dance and Tell Compelling Stories
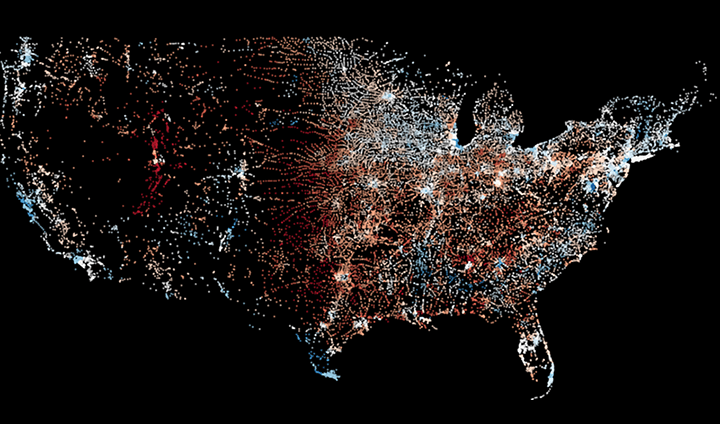
With SandDance, various types of data is assigned colors and are represented by dots. These dots can twist and twirl like grains of sand on display, hence the name SandDance.
This flowing and dancing animation is not just for show, however. It allows users to be a storyteller of data that was once only presented in tables and lists or static graphs and charts.
With SandDance, data visualization is taken to a whole other level. Data is transformed into relevant facts and figures that are rich with context and insight. It also helps transform how you analyze and present information.
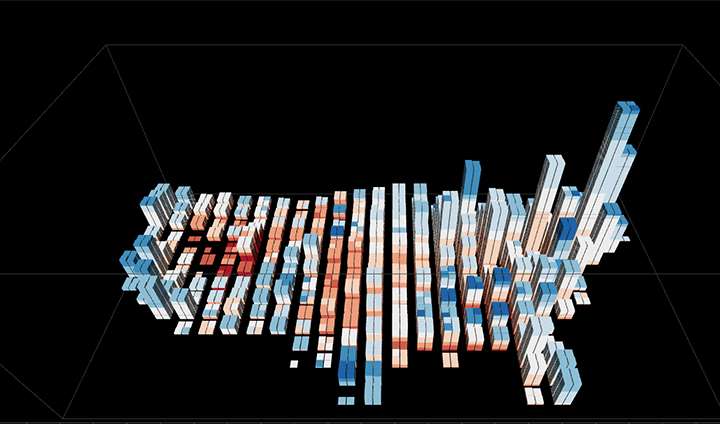
Data can then be sorted and arranged to form relevant images, such as shapes, countries, and many others. These data points can also be further arranged into 3D stacks so that data as a whole or individually can be viewed at practically any angle. This will allow users to reveal various perspectives that are critical to gaining better business information.
Pull Large Amounts of Data and Visualize it with Ease
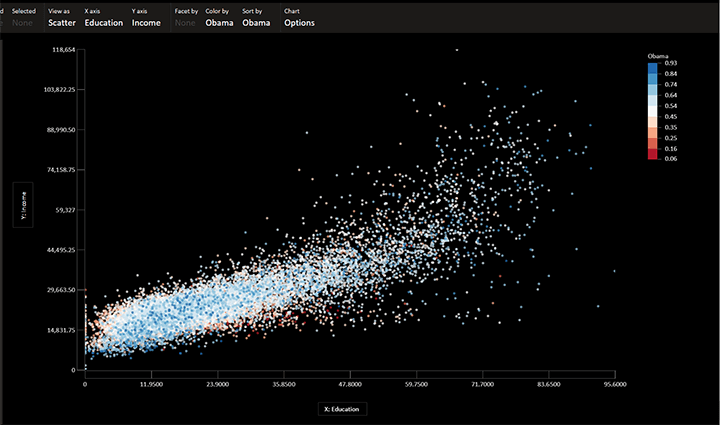
SandDance works best for data that has not yet been aggregated, for example, voting results and population information. The individual records can then be rearranged and sorted in groups through SandDance to create relevant connections and context.
Once a SandDance chart is made, you can change the View settings, which includes a 3D view. You can also use Facet View to see the visualization broken up according to the different ranges of a particular attribute or variable. Furthermore, you can Sum by any column in the dataset. This create something more than just a summary chart but a range of multiple rectangles. You can assign different colors to the rectangles in the Color by options to select through a diverse color palette.
To change the behavior of the dataset, you can drag the curser from the default of selecting various shapes. You can also zoom or choose 3D rotate through the navigation panel button in the menu bar. Aside from these functions, there are so many more features you can explore by enabling the Settings button.
Go to Microsoft SandDance