
Advertisement
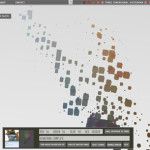
Make Amazing Data Charts With Microsoft SandDance
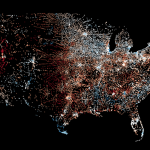
Data visualization can make everything look better and more understandable. From simple stats to comprehensive analysis, visualization tools such as charts and graphs can greatly help you gain better insight into your business, projects, surveys, and reports. With this in mind, Microsoft has developed SandDance, a free data visualization app that helps you create stunning …