How to make a Gaussian Curve in PowerPoint
Gaussian Curve (also known as the Gaussian Bell or Bell Curve) is a statistical curve very popular in probability theory. The normal (or Gaussian) distribution is a continuous probability distribution that has a bell-shaped probability density function, known as the Gaussian function or informally as the bell curve.

You can learn more about the Gaussian function on Wikipedia but if you need to design a simple Gaussian Chart for your PowerPoint presentations, then here we will show you a simple approach.
How to make a Gaussian Curve in PowerPoint
Draw a perfect Gaussian Curve from a function
A possible approach is to use a Chart from Excel spreadsheet representing the values. Here you can learn more in the Official Office help How to create a Bell Curve chart or bell curve template.
You can use free online tools to plot functions, like fooplot or graph.tk. The second one offers a console where you can enter the math function and then take screenshots of the output. You can copy and paste the charge in PowerPoint.
Draw a simple Gaussian Curve in PowerPoint using Shapes
However, in some other situations you just want to make a draft or simple curve to show. To draw a simple Gaussian Curve in PowerPoint you can get inspired from a Gaussian curve in Google. Just look for Gaussian Bell or Gaussian Curve diagram or chart in Google Images. Then copy the image and paste it temporarily in your slide.
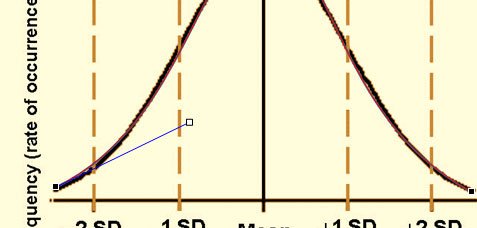
Now, start tracing an image using the curve line.
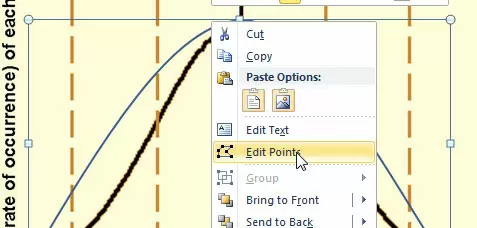
Finally, edit the points so you can adjust the inflection points.
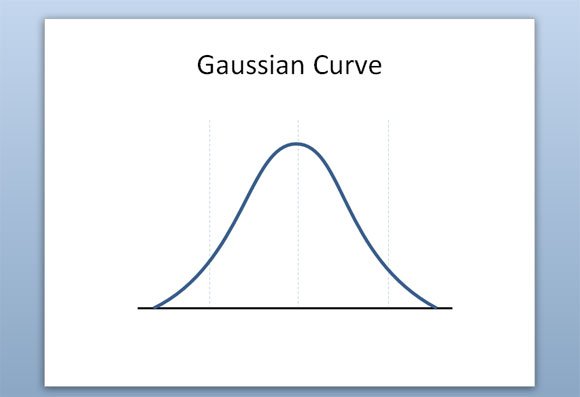
Once you finished tracing the Gaussian curve, just remove the temporary image and modify the style for the curve. Here you can sea an example of Gaussian curve created after tracing a graphic in PowerPoint.
Using this same approach you can plot other functions like the standard curve function or any other needed curve. Moreover, you can create box plot or curves in PowerPoint with the simple curve function or Curve shapes.