
Advertisement
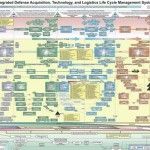
Treemap Visualization: Quick Guide to Visualizing Hierarchical Data
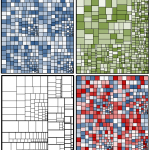
A treemap is a powerful visualization tool that helps present hierarchical data through nested rectangles. Each rectangle represents a category or subcategory within the hierarchy, and its size is proportional to a specific numerical value, such as sales figures or file sizes. Treemaps are especially effective for comparing the sizes of different categories, and they …