How to Conduct a Survey — Quick Guide from Beginning to End
You can conduct a survey using online tools, a PowerPoint presentation during an interactive session, a Focus Group Discussion, or reach out to a target audience by going out to talk to people in person. How you conduct a survey depends on a number of factors including your goals, target audience, available resources, etc. If you want to learn how to conduct a survey, you can follow the few easy steps mentioned below.
Step 1: Identify Your Survey Goals
Are you conducting a baseline survey at the start of a project? Do you want to conduct a survey for a school assignment or research paper, or do you have business and marketing goals in mind? The first thing to do when conducting a survey is to identify your goals. You need clear, well-defined goals to be able to make sense of what you are about to do by laying out the goals of a survey.
Example: A car company (Company X) is facing a decline in sales, while competitors have begun gaining market share in the country. The company aims to conduct a survey to learn about why people might prefer other cars and what might be the cause for their decline in sales. In this case, the company’s goals should include understanding customer needs, identifying what might be the edge that competitors have, and finding ways to boost sales by addressing customer needs and concerns.
Step 2: Identify Your Target Audience
It is important to know who you are willing to ask questions before you start writing them down. Are you looking to target suburban housewives, people who fall in the low, medium or high-income group, or individuals of a certain age range? Some factors to consider when finalizing your target audience may be factors such as age, gender, ethnicity, area, income, etc.
Example: Company X has always had success with high-income households who have historically bought their SUVs and sedans. This includes people from high-income households aged between 35-60 years of age. The company chooses to target this age group among men and women in the country.
Step 3: Choose Your Medium
It is important to understand what medium to use to reach out to your target audience. Do you intend to target them using social media, email marketing, and pay-per-click ads to direct them towards a survey form? Do you intend to send a team door to door or wish to contact people by phone?
Example: After some deliberation, Company X chooses not to offer the survey via social media to avoid saturating results with people who might not fall in the segment that can afford their high-end cars, such as aspirational buyers. Hence, Company X chooses to set up booths for 4 weeks at high-end retail stores, shopping plazas, and luxury hotels to attract people from the target audience to fill out their short survey forms. The survey participants are offered a chance to enter a lucky draw where they can win a new SUV. The company also decides to email the survey to former clients from their mailing list with the same offer.
Step 4: Write Your Questions
Once you have identified your goals, target audience, and the medium(s) you intend to use, you can start writing questions. During this phase, you can engage people who might be relevant to help draft questions that might be important. Make sure you keep in mind factors such as age, gender, and other essential details to ensure you are able to disaggregate the data.
Example: Company X engages employees from various units including the marketing team, members from the research and development unit, and a handful of individuals from their outlets and service centers to help draft a survey. The questions for the survey are then presented before the senior management for deliberation and approval, after which the questionnaire is sent out to gather data.
Step 5: Monitor Survey Response and Gather Data
During the survey, you might find out that people aren’t very responsive to your survey. In this case, you might need course correction and even alter the survey. But such a radical move should be made at the very start of the survey. Companies with a dedicated team of professionals might not need to do something like this. However, students and people new to conducting surveys might require making subtle changes to make their survey more attractive.
Gathering responses and consolidating them correctly is also an important part of conducting a survey. Whether you’re using an Excel spreadsheet, a software application like EViews or SPSS, or a combination of different tools, it is important to ensure your survey forms don’t end up getting duplicated or inaccurately gathered.
Example: Company X at the end of the survey timeline (4 weeks), gathers responses from online and offline survey results and compile them for analysis.
Step 6: Analyze Your Data
Data analysis needs to be done carefully, based on your survey results. You must ensure that not only do you analyze the data that is obvious but also try to find comparisons that stand out. Do people from a certain age range have specific preferences? Do people from both genders respond differently to some questions? You might need to perform a cohort analysis for this purpose to dig deep into the data to find factors that stand out. There are a wide array of tools that are used for this purpose, ranging from spreadsheets made in Excel to complex data analysis applications like Microsoft SandDance.
Example: Company X gathers the data from its online survey and offline forms and sends it for analysis. The team creates a report with aggregate and disaggregated results to try to identify what might be the cause for the decline in sales of their high-end cars in the country.
Step 7: Write Your Survey Report
Once you have gathered and analyzed your data, it’s time to write your survey report to make your findings count. You need to ensure that your report is not oblivious to the goals you set out at the start of the survey.
Example: based on the survey results, Company X identifies that people mainly from the younger age cohort (35-49 years) seem to be more interested in competitor products. Among the surveyed individuals, at least 65% had previously bought a car manufactured by Company X, however, among the younger age cohort, 45% seem to be less satisfied with the features offered by their cars, whereas 33% of the older age cohort (50-60 years) seem to be unsatisfied with their cars.
The bone of contention among customers appears to be late car deliveries, less sporty features, outdated design of cars that haven’t seen much improvement in more than 5 years, and a price tag that does not seem to justify the product as per customers’ requirements. On the contrary, customers from almost all age groups seem to like the new variants of Company Z, which is at least 20% cheaper than the SUVs and sedans manufactured by Company X. Their cars also come with more comfortable seats, a design that customers find classy and fresh, as well as better features including a more robust climate control system, entertainment package, and an extended warranty. Company x also discovers that people are more interested in environmentally friendly electric cars than their combustion engines, which has given the company a bad reputation when it comes to being socially responsible.
8. Present Your Survey Data
You might need to create a document or additionally, a PowerPoint presentation to present your data. In this case, you can use a PowerPoint template to present your report findings. Below are a few suggested templates that you can use for this purpose.
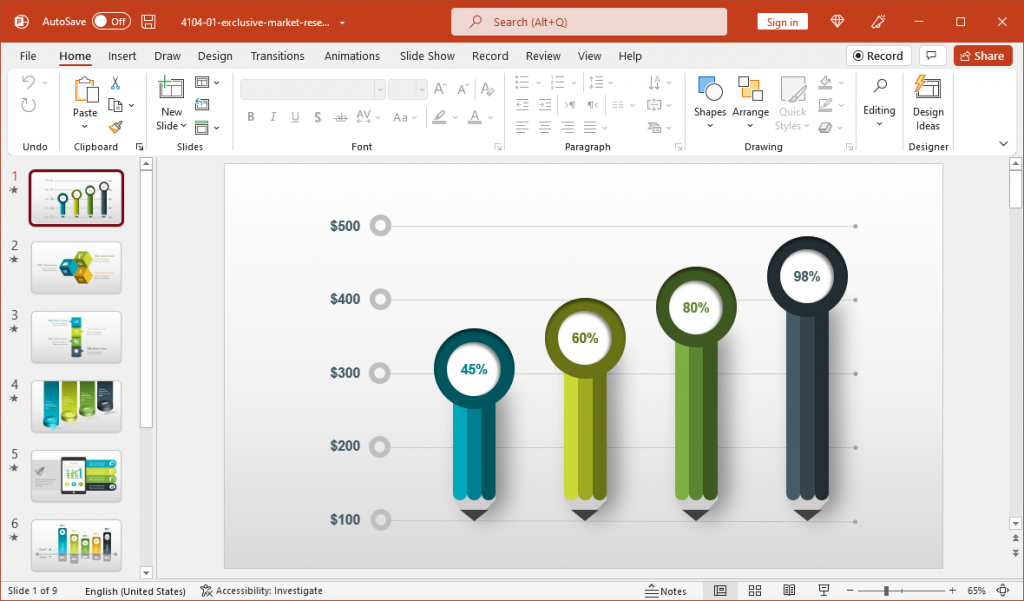
Exclusive Market Research PowerPoint Template
If you want a PowerPoint template that can stand out when presenting your research data, this slide deck with 3D illustrations might be just what you need. The Exclusive Market Research PowerPoint Template can be your go-to template for making and presenting your research reports to present the data that is most relevant to your survey goals.
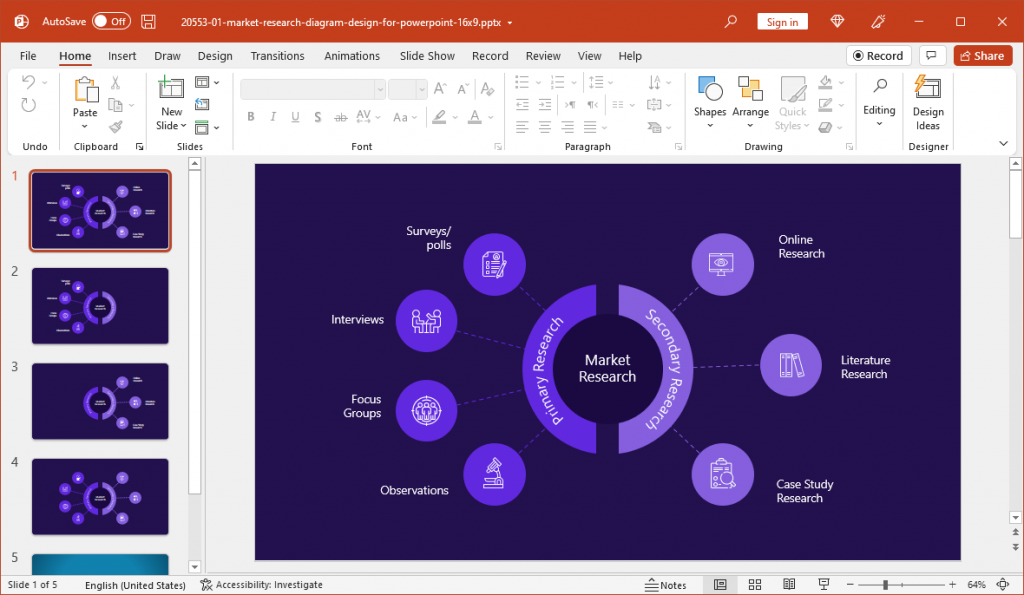
Market Research Diagram PowerPoint Template
This is a PowerPoint template designed for presenting your market research as diagrams. It comes with editable diagrams to help you present the big picture in fewer words and easy to grasp diagram slides.
Research Plan PowerPoint Template
Whether you want to make a presentation before or after you conduct your survey, the Research Plan PowerPoint Template can help you present a research plan or key findings of a survey result using a set of slides with editable diagrams, charts, and customizable infographic slides.

Final Words
Conducting a survey requires objectivity. One must not jump to conclusions or have an approach that merely confirms to pre-determined ideas. The concept behind conducting a survey requires one to be neutral and even be willing to accept some uneasy facts that might not comply with the researcher’s perception. Being objective is not only essential but can also enable making a survey that provides valuable information to direct goals that can have a major impact.
If you are someone looking to conduct online surveys with minimum resources at your disposal, you can use tools like SurveyMonkey, MailChimp, Google Forms, etc. For this purpose, you might find our post about the Marketer’s Toolbox helpful in identifying tools and strategies that might be suitable for you.