Create Animated PowerPoint Charts From MS Excel Data With Oomfo
Many a times when one requires compiling a wide range of data for presentations, the data needs to be imported from Microsoft Excel and represented in a stripped down manner in PowerPoint presentations. This can be an extremely laborious, time consuming and boring task. Moreover, the charts created with such data may not be very attractive or even accurate, as processing the data can be quite difficult. Oomfo is a MS PowerPoint plugin that makes it possible for users to create animated PowerPoint charts by importing complex data sets from Excel.

Create Complex Charts Without Any Coding
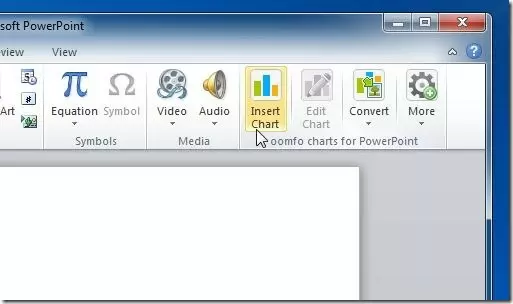
This PowerPoint plugin has been specially designed for the convenience of business users and offers a simple wizard to help create animated charts. With Oomfo you can create charts ranging from the basic bar or column charts to anything like Waterfall and Marimekko charts, without having to do any kind of coding. Oomfo installs like any common PowerPoint add-in via a simple EXE file. Once installed, you can find Oomfo options from the Insert tab in PowerPoint – users can find Oomfo options via the Insert drop down menu.
Connect to Excel Spreadsheets or Live Data
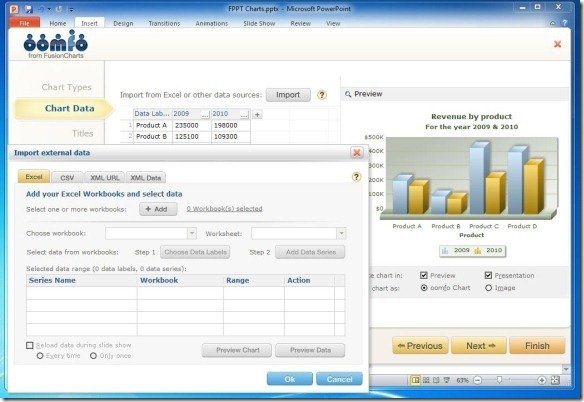
No need to copy Excel data or to manually plant it across charts. With Oomfo you can connect to multiple Excel spreadsheets during or prior to your presentation and extract live data from them which can be displayed as charts. To connect an Excel file to a chart, go to the Chart Data tab during the chart making wizard and click Import. You can see the complete chart making guide for Oomfo from this link: How To Create Charts With Oomfo.
Integration With Cloud Services
Oomfo also comes with integration with services like SalesForce, Google Docs, Google Analytics and Twitter Analytics. You can connect XML URL and XML Data from the Chart Data tab.

Creating Animated Charts With Oomfo
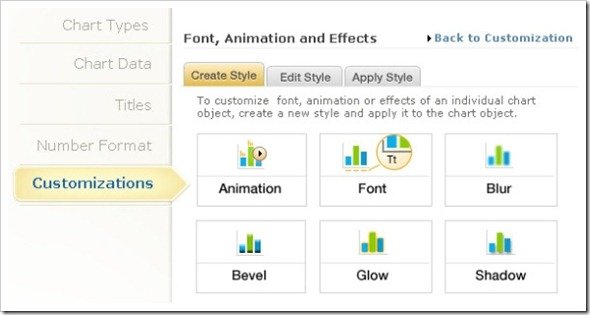
Oomfo uses FusionCharts, which provides a wide range of tools like scroll, zoom, chart cosmetics, etc. This can enable you to create animated charts. Furthemore, you can even convert your charts to Flash format and embed them as flash animations in a slide. When a chart is converted to Flash format it appears with a cross image. This image turns into a flash slide when it is run in SlideShow mode. Chart animation options can be found from the Customizations tab during the chart creation wizard. This tab provides the options to customize your charts with visual animation effects and different elements. From this tab you can configure your Font style, Bevel style, Glow style and other options to animate your charts.
Demonstration For Creating Interactive Charts With Oomfo
You can learn more about creating interactive charts in Oomfo from the video given below.
Oomfo is free to use and works with the following versions of Microsoft PowerPoint:
- MS PowerPoint 2003
- MS PowerPoint 2007
- MS PowerPoint 2010
- MS PowerPoint 2013
Go to Download Oomfo