In this category you can find lot of free resources and articles on how to make awesome diagrams for PowerPoint 2010 and 2010.
You can learn how to make 2D and 3D diagrams using basic tools like shapes and PowerPoint SmartArt graphics. Designing diagrams for presentations is a common task, but many business diagrams can be found for free and quickly inserted into your PowerPoint presentations, however some other custom diagrams should be created and edited by the presenter or presentation designer so here you can learn how to make impressive diagrams for your presentations.
A flowchart is meant to display a task or process in a sequence. Such charts are often required for making business diagrams, models showing production processes and tasks. There are various methods by which you can create flow charts in PowerPoint, including with the help of SmartArt Graphics, shapes and readymade templates. What is a …
In PowerPoint you can make org chart and other tree graphics easily using SmartArt graphics, for example if you need to make a family tree or display data in a tree. However, in some situations it would be enough to use shapes and use lines to connect the tree. Here we will show you a …
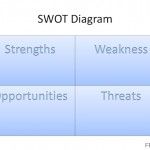
There are lot of diagram designs that we can purchase and download from stock images, but if we are interested to make our own SWOT diagram in PowerPoint then we can use the powerful SmartArt and Shapes feature to design it. Then we can apply some nice styles and effects to make it awesome. In …
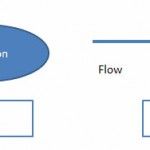
A data flow diagram is a visual representation of data flow in an information system. Data flows are an important visualization tool to model processes. You can use Data Flows to create an overview of the system which can later be elaborated just like a simple mind map diagram, or you can also use DFD …
Gauges have lots of drawbacks in corporate dashboards but sometimes this is what the customer want to see, especially top managers and CEOs. Aside of other visualization tools, gauges can be very basic and decorate your reports or PowerPoint presentations. By default PowerPoint do not come with gauge templates that you can use for your …
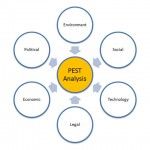
PEST Analysis is usually represented by a diagram with a central spot and arrows pointing towards the center of a circle. This kind of diagrams and representations are used to show the This tool is widely used to help understand the big picture in certain environments for example Political, Economic Socio-Cultural and Technological environment you are …
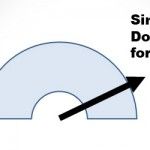
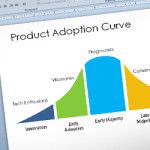
New Product Diffusion is the process by which the market accepts a new idea or new product, and it is a concept widely used in business presentations and product development. We have created a free new product adoption slide template for PowerPoint & Google Slides that you can use to display a New Product Adoption …
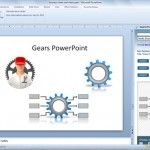
You can use gears in any business presentation where you need to show interlocking ideas. Using this SmartArt shape, you can add three lines of Level 1 text corresponding to a gear shape. Their corresponding Level 2 text appears in rectangles next to the gear shape. Unused text does not appear but remains available if …
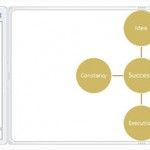
Some diagrams require to show a central idea in a cycle and then relationship with other secondary ideas. This is the case for example in marketing when we want to create the 4P of a Marketing mix to be used in a Marketing plan. 4P of Marketing mix or other complex diagrams can be created …
Sometimes, you must design a creative organization chart for your corporate presentations, but you need help finding good ideas. This article will review some innovative organization charts that we can find online with information about the company and corporate structure, from the top CEO to the low-level employees within an organization. Typically, organizational charts are …