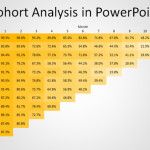
Cohort Analysis it’s a time-tested segmentation technique used to understand user behavior and recently adopted by authors of Customer Development and Lean Startup methodologies. In Running Lean and Lean Analytics books there are mentions to cohort analysis since this segmentation technique can help entrepreneurs to understand the behavior of early adopters of your product or startup …
If you need to present to stakeholders, then the Burgoyne’s stakeholders analysis matrix can be useful. Basically, you can design one of these matrix easily in PowerPoint using a diagram with a PowerPoint table where on the Y axis represents the level of influence and the X axis represents the reaction to change. Senior Managers …
Recently we introduced RACI Matrix Template for PowerPoint. The RACI matrix is a simple table that will list the tasks to be accomplished (rows), the list of persons (columns) and one responsibility. RACI Matrix stands for: Today you can download this free RACI Matrix from diyPlanner.com, a popular website where you can find resources for Do …
Microsoft PowerPoint is one of the best programs to create presentations and very popular worldwide. One of the best features is the capability to create animated PowerPoint presentations to attract your audience attention, in fact we have published lot of free animated PowerPoint templates for presentations. Today we are going to show you how to animate …
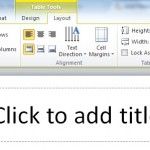
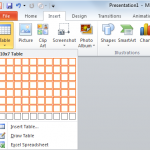
PowerPoint can help you to show important data and graphics simply and easily. Creating tables in PowerPoint is one of the best, and it will allow you to show a lot of information in a confined space without wasting any time or work in vain. Step by Step – How to Create a Table in …
There may be times when you want to copy charts from Excel into your PowerPoint presentations. For example, if you are preparing a dashboard in PowerPoint or the annual organization report before the strategy planning. In this case, we will be interested in copying charts from Excel spreadsheets into PowerPoint. Let’s say we have the …
Sometimes you need to copy your data from Excel Spreadsheets to PowerPoint presentations, or not the data but the charts in order to show summarized data to the audience or show the visualizations in dashboards and reports. In order to copy the data or charts in Excel to PowerPoint, you can simply use the Copy …
In an era where information is at our fingertips, the need for efficient and effective learning models has become more crucial than ever. Among various techniques, the KWL model has emerged as a powerful tool, facilitating the learning process and aiding the retention of knowledge. This article is designed to help you understand what the …
Maslow’s hierarchy of needs is a theory in psychology, proposed by Abraham Maslow in his 1943 paper A Theory of Human Motivation. Maslow subsequently extended the idea to include his observations of humans’ innate curiosity and this chart become part of any introduction to business and organizations, so often we will need to download free …
Microsoft Office programs such as Word, PowerPoint and Excel have been around for so long. They’re widely recognized and used in many business and academic activities, and considered as reliable companions in creating documents, managing data, or presenting an idea. While these programs are great in themselves, add-ins are there to make things a little …