Download free chart templates for PowerPoint presentations and learn how to make your own 2D and 3D charts for PowerPoint presentations. Find useful chart ideas and visualization tools that you can use for sales presentations or any presentation requiring a chart design.
Charts are very useful when we need to explain certain data to an audience and want to avoid full text paragraphs. By using charts we can follow the rules of an image showing more than thousand words. Here we will see how to insert a radar chart in PowerPoint. To create and insert a Radar …
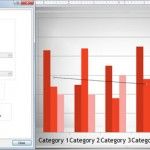
Charts can be handy in presentations where you need to show data. This is sometimes preferred against complex tables as a visualization tool because the audience can get a better view of what you want to show. However, the charts should be prepared according to your presentation to make them readable. PowerPoint charts are very …
In PowerPoint, you can save your chart design as a chart template for future use. This feature can be really helpful if you want to design custom charts using styles and effects and save it as a template using your corporate visual identity or brand identity. You can also use chart templates to speed up …
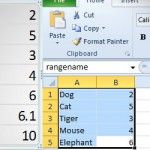
Sometimes you need to copy your data from Excel Spreadsheets to PowerPoint presentations, or not the data but the charts in order to show summarized data to the audience or show the visualizations in dashboards and reports. In order to copy the data or charts in Excel to PowerPoint, you can simply use the Copy …
When you’re creating PowerPoint presentations, listing your ideas and data in every slide can make your slides look dull. It’s nice to break it up with images and visuals. And while pictures can paint many words, if you want to present comprehensive information, you have to have charts. Here is a tip on how to …
When it comes to productivity and collaboration, Microsoft Office is leading the game. Not only does it have the most advanced programs and features; it also keeps updating them to suit the needs of today’s users. One of its biggest selling points today is its collaborative feature. This allows Office users to work on the …
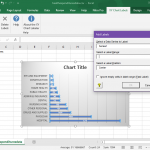
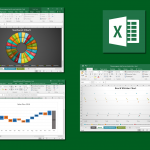
In Microsoft Excel you can create charts easily using the built in chart feature. This article will show you how to create a simple line chart in Excel. First, we will use a simple table that have many different series, but for simplicity we will take one serie at a time. One of our users contacted …
If you need to prepare excellent business presentations then you can opt either to create your own presentation and slide design from scratch, reuse any of the PowerPoint presentation templates that you can download for free from our site, or purchase any premium PowerPoint template from sites like PresenterMedia that offer awesome animated PowerPoint templates …
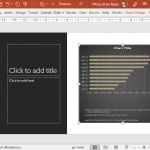
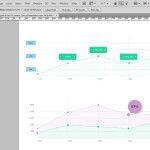
When you’re creating charts and graphs in Excel, the process is pretty much straightforward. You use the built-in Wizard within Excel to create compelling visuals that analyze and represent your data. Usually, when you create charts, you can format your chart labels with Series Name, Category Name, and Value. You can label them however you …
Decision-making is one of the trickiest parts of running a business. One wrong move and you can send your company down the drain or risk your brand’s image. When it comes to running a company or a business, you are not only thinking and deciding for yourself. You’re also deciding for your whole organization. You hold …