Add-in

How to Make a Geographic Heat Map in Excel

Create Your Own Heat Map

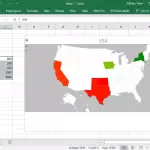
Visualizing data can help you better understand what could be a difficult set of information if you’re just looking at purely numbers. This is why charts, graphs, infographics and geographical heat maps are very useful, not just in reports and presentations, but also in helping you make sense of data. Such visualizations can also help …

Easily Merge Worksheets in Excel with Ablebits Excel Add-In

Select the Table You Want To Update

Data management is critical in any business or organization. It’s important for people to understand and analyze data thoroughly in order to make better-informed decisions. This can also allow people, like managers, executives, and business owners, to plan appropriately based on the available data. Therefore, the information must be correct, complete, and accurate. When using …

Turn Your Data into Explorable Networks in Excel

Create-a-New-Table-Or-Select-One-For-Gigraph

Working with Excel spreadsheets and analyzing data as well as catching trends can be tedious and time-consuming. However, it must be done. Analyzing data is important, especially at this time when we deal with large amounts of information on a daily basis. To help you make better sense out of your data, you can use …