Advertisement
How to Automatically Use CC or BCC for Microsoft Outlook
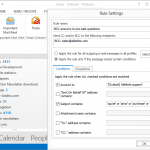
In business, certain organizations would have management require that they are in the loop of all your outgoing messages, especially when it concerns clients. This can be done through BCC or blind carbon copy, wherein the BCC recipients are not visible to other recipients in the email. Similarly, CC, or carbon copy, means the recipients …