Pareto Chart in PowerPoint
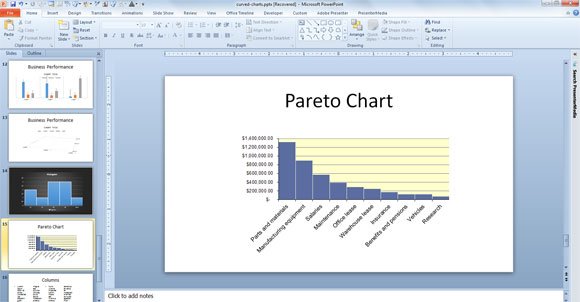
If you need to prepare a Pareto Chart in PowerPoint then this article can be really helpful. We will show you how to create a Pareto Chart in PowerPoint 2010 but also for PowerPoint 2013 that you can use for example to create a Cost Analysis Chart for PowerPoint presentations.
For this purpose, we will start downloading this free Excel template with a Cost Analysis sample and Pareto Chart that will be useful to make a similar chart for our Cost Analysis PowerPoint presentations.
Download Excel Pareto Chart Template from the official Office website with tons of free templates for MS Office products including Microsoft Project, PowerPoint, Excel, Access, etc. This is a free cost analysis template for Excel that contains a worksheet for logging expenses by cost center. Then you can access another secondary chart showing a visual representation of the expenses in descending order.
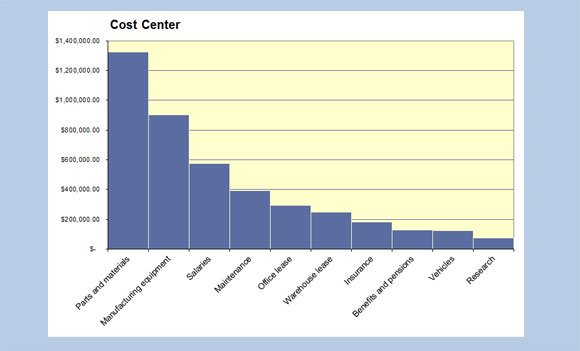
Then, you can copy the chart from the Pareto chart worksheet and paste it in your PowerPoint presentation. You can use this kind of Pareto Charts to focus on areas of priority or prioritize factors and put them in graphical form in a simple and quick manner.
As you can see, this Pareto chart with cost structure in descending order can be used for inspiration in any other Pareto presentation or cost analysis PowerPoint presentation.