Mastering Tables in PowerPoint
PowerPoint has some excellent table capabilities that you can use to embed tables in your slides. By default, when you create a table using the standard way, the table will be static. If you need to edit it, then you need to edit the cells individually or in groups, but there are other ways to keep dynamic tables and get the data from Excel.
How to Insert a PowerPoint Table using the Table Builder
Here we will show you the most important options while working with Tables in PowerPoint.
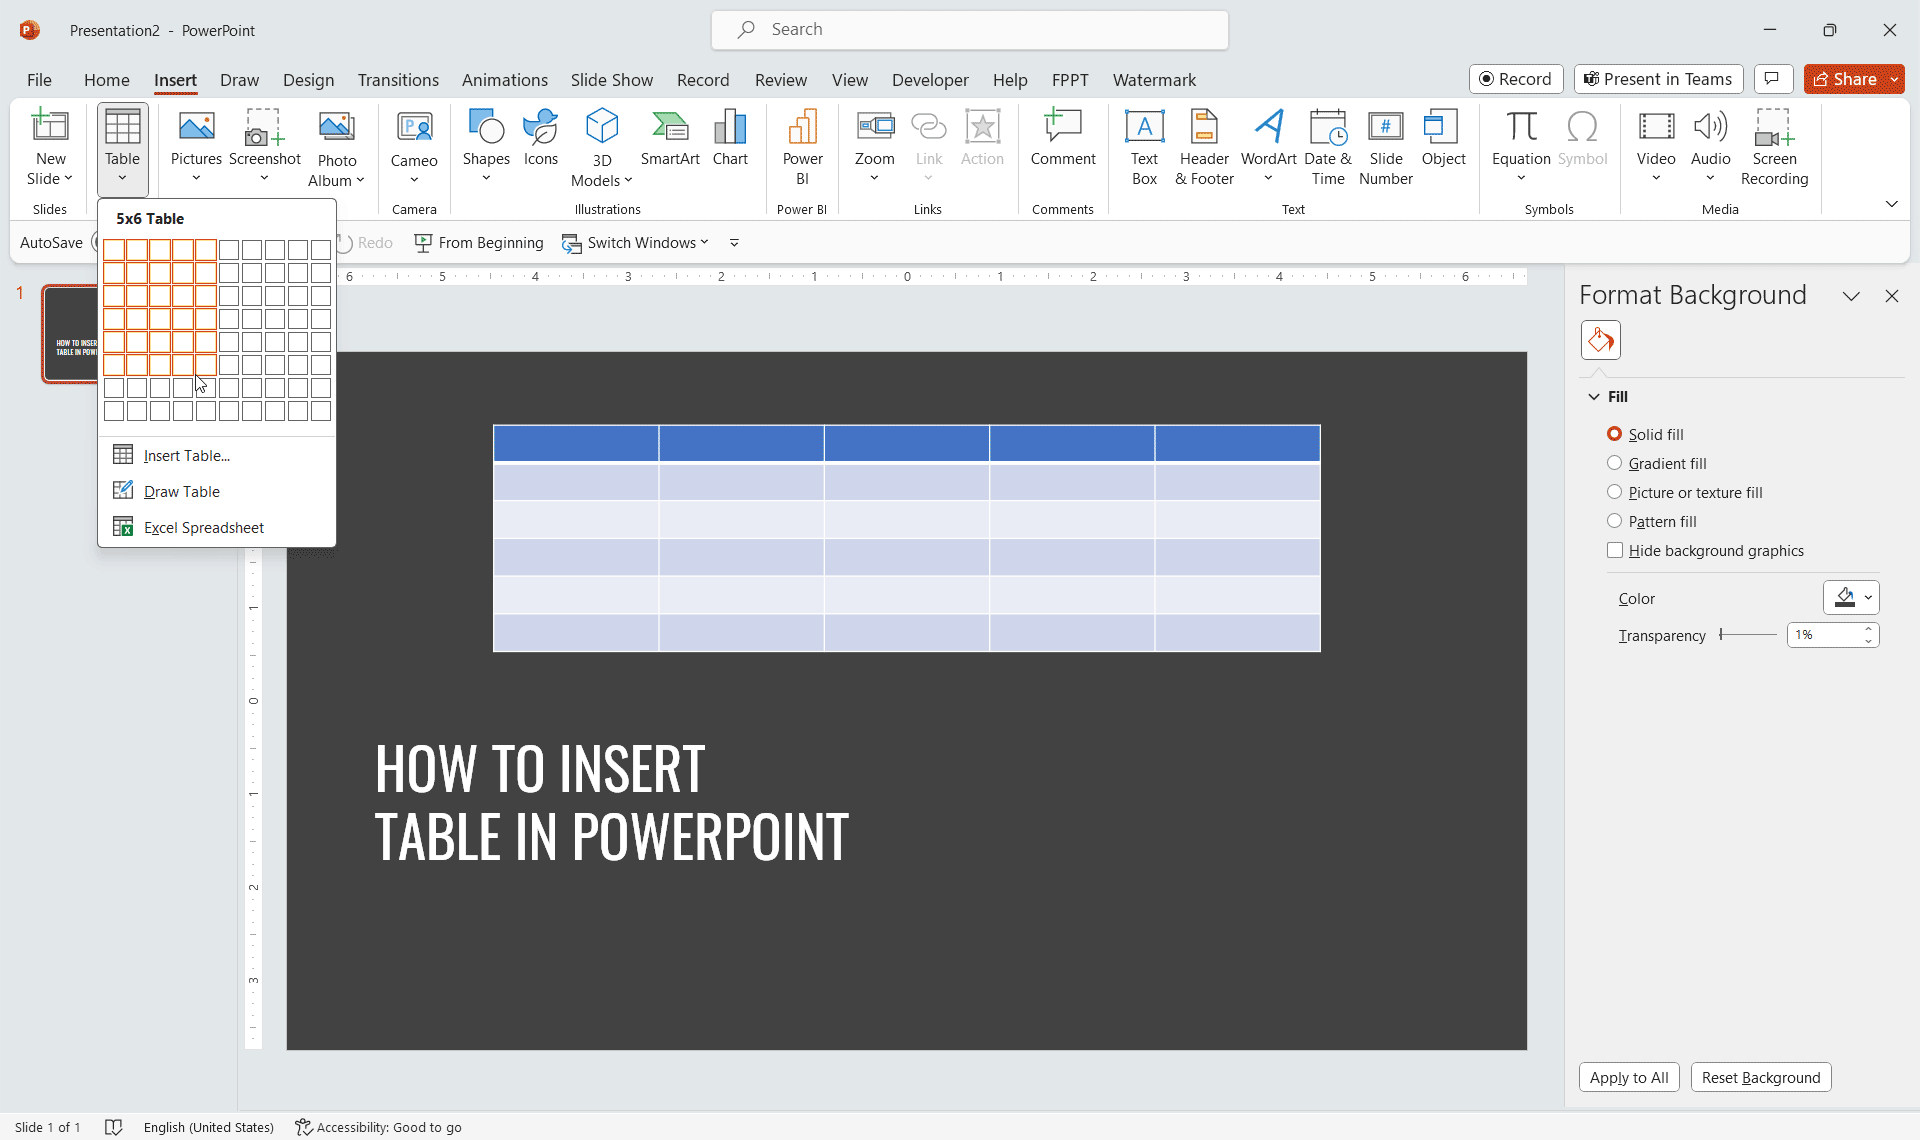
To Insert a Table in PowerPoint you can go to the Insert tab in the menu, and then click Table. A popup will appear to select the number of cells of the table to insert.
Alternatively you can click on Insert Table… option to enter the number of columns and rows manually, or draw a table with empty rows and columns. Don’t worry you can add more columns and rows later.
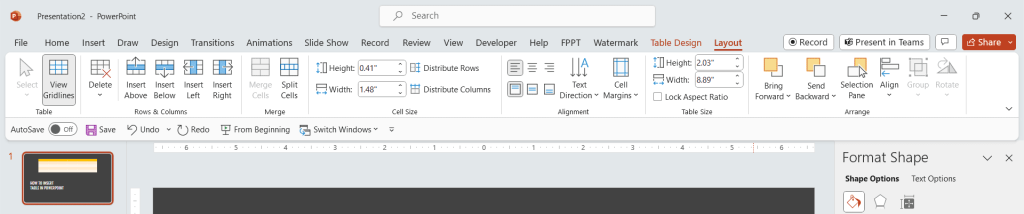
Once you draw the table, two new ribbon menu will appear: Design and Layout.
Design Menu will let you update the table design options.

Layout menu lets control the way tables are displayed and how rows and columns are distributed, as well as adjusting margins and other options.
Inserting a table from Excel in PowerPoint slide
If you don’t want to keep changes in the slide, but prefer to edit the table in Excel and then embed it, then you can use the Excel Spreadsheet.

You can see in detail how this work by reading our article about how to insert Excel in PowerPoint.
In this video we will review some of the features that are available when you work with Tables in PowerPoint.