How to Insert a Linked Excel Chart in PowerPoint
When you’re creating PowerPoint presentations, listing your ideas and data in every slide can make your slides look dull. It’s nice to break it up with images and visuals. And while pictures can paint many words, if you want to present comprehensive information, you have to have charts. Here is a tip on how to insert a linked Excel chart in PowerPoint.
In fact, charts add a little more “oomph” to your slideshows. They are a great substitute for long lines of text. You may also condense a few slides into one with a thoughtfully created chart. And, to make your job easier, you can even pull a chart from Excel and use it on your PowerPoint slides. In order to do this, you have to do the embed function from PowerPoint and link an Excel Chart. Take the following procedures.
Link Excel Charts in Your PowerPoint Slides
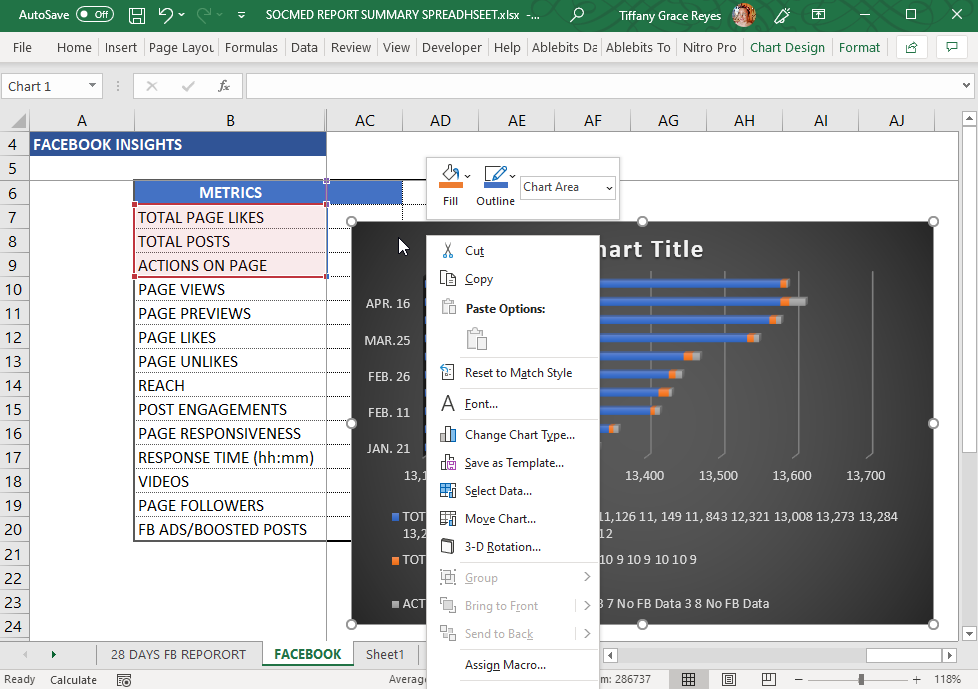
To insert a linked Excel chart in your PowerPoint slides, you have to first open the Excel file where you have your data and chart. Then, click and drag the cells you want to highlight and copy. Then, right-click on the copied cells then select “Copy”.
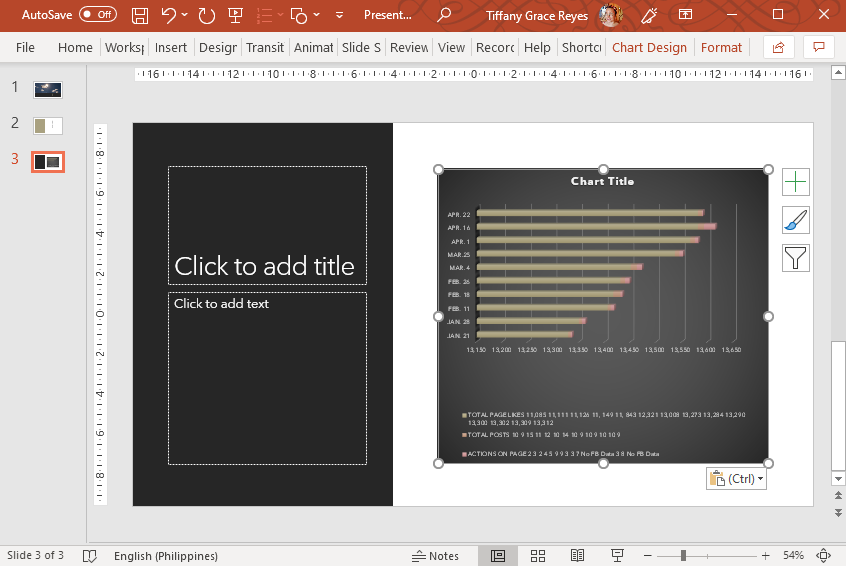
Now that you have copied the cells that you want to link to PowerPoint, open your slideshow file. Then, right-click on the slide and select Paste Options. You may choose Use Destination Styles, Keep Source Formatting, Embed, Picture, or Keep Text Only. Let’s go over each option. The Use Destination Style option allows you to edit your copied cells like a PowerPoint table, using your slide’s given color scheme and fonts. If you want to choose the same formatting of your cells from Excel, then choose Keep Source Formatting.
Embed and Link Your Excel Chart onto Your Slides
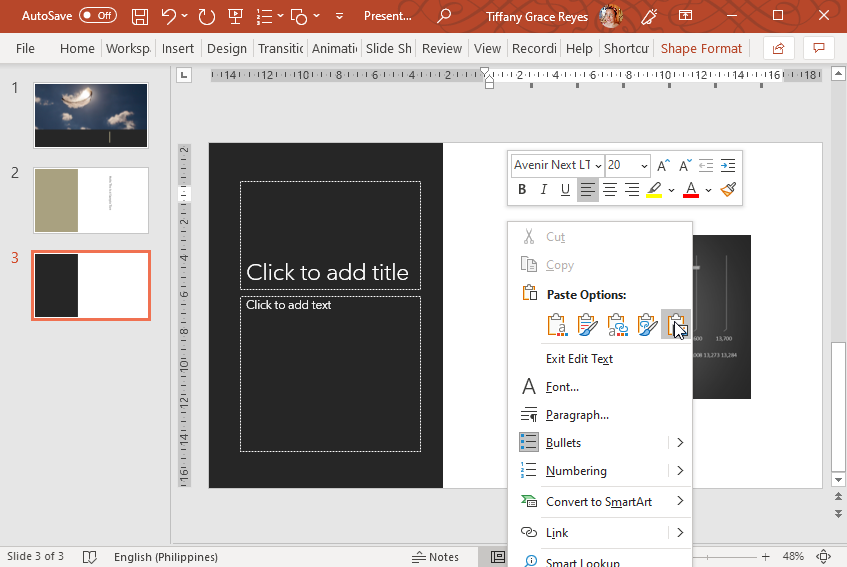
Then, if you still want to keep a copy of your table in PowerPoint for editing purposes, then you may choose Embed. Meanwhile, if you want to keep the look of your cells and be able to add picture formatting and effects to it in the same way as you would onto a photo, then choose the Picture option.
You may also opt to only keep the data as a straight line of text without any graphics or any other element. In this case, you may choose Keep Text Only. Meanwhile, if you have chosen the picture, you can go to the Picture Tools Format tab to select the picture style you want. You may also apply various picture formatting, such as color correction and brightness settings. Now, if you have chosen to link your Excel chart into your PowerPoint, you may notice that any change you make on the original spreadsheet file is reflected automatically on your PowerPoint chart.