Gapminder: Find Statistical Data For Presentations With Videos And Charts
Some people like exploring statistical data to learn about interesting facts, however stats are the last thing that most people consider fun to work with. Gapminder is a non-profit venture to provide people with the chance to explore statistical data in a fun and interesting way. The aim of this venture is to provide stats related to various essential topics to help create awareness about numerous subjects. These stats can be explored via the Gapminder website or by downloading the cross-platform Gapminder Desktop application.
The Home Page of the Gapminder website shows a few featured topics related to global stats about health, CO2 emissions, religion, agriculture, etc. Clicking on a topic provides you with a video and link to a statistical graph related to the subject. This way you can not only explore interesting facts about various subjects but also find data for research projects, PowerPoint presentations, corporate research, etc. One of the biggest advantages of using this data is that it is collected from reliable sources, as Gapminder works closely with universities, UN organizations, NGOs and public agencies.
The Gapminder website provides convenient tabs to find relevant data sources. For example, you can start exploring different topics via the Data section, whereas videos related to a specific topic can be found from the Videos section.
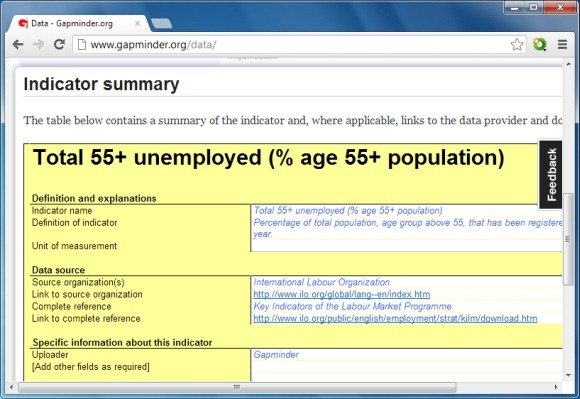
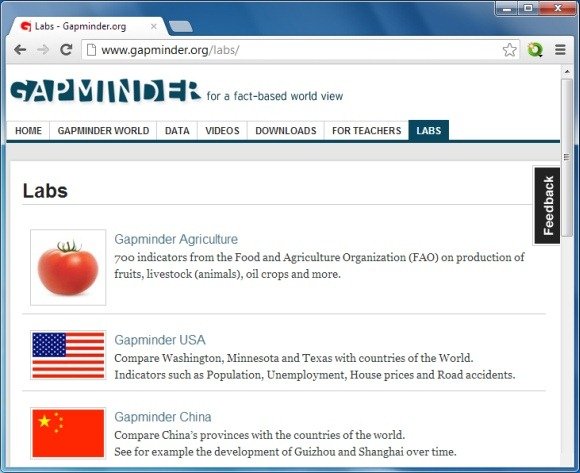
While the Data section provides stagnant data and links to related websites, you can explore dynamic graphs related to different topics from the Labs section.
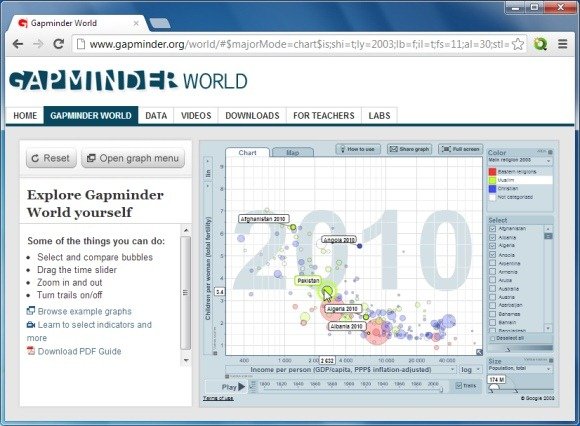
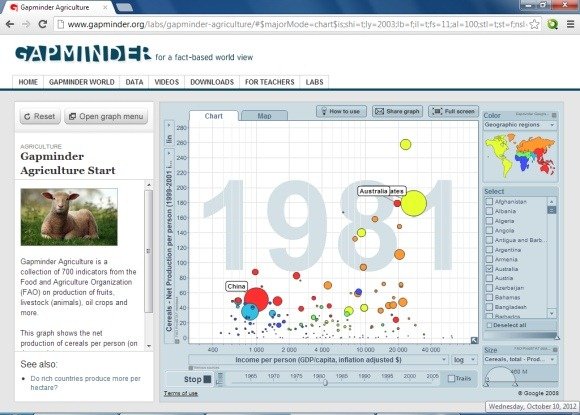
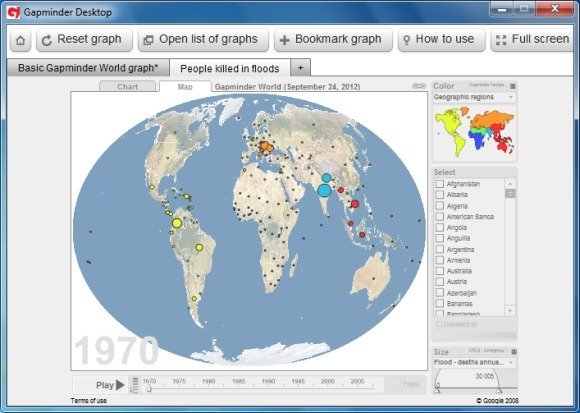
You can even Play charts and observe changes in data. Playing a graphs starts a countdown of years, in relation to which the data starts changing (within the graph). Gapminder graphs are quite dynamic and users are provided with various options to filter results to include and exclude elements (e.g. country names). You can even click on chart elements for better data analysis. Furthermore, these charts also come with different types of viewing options such as a Map View and Full Screen Mode. Gapminder charts can be shared via the Share Graph option. If by any chance you find the graphs confusing, you can refer to the How To use section which provides a helpful video tutorial. Interestingly, we found a chart at Gapminder which had the IBM Many Eyes logo. This might mean that some of the data charts at Gapminder might be from sources such as IBM Many Eyes.
If you wish to explore the available data right from your desktop, you can download the desktop application via Downloads section. With this desktop application you can use Gapminder offline and save a list of graphs to suit your needs. At start up, the Gapminder desktop application prompts you to select a subject.
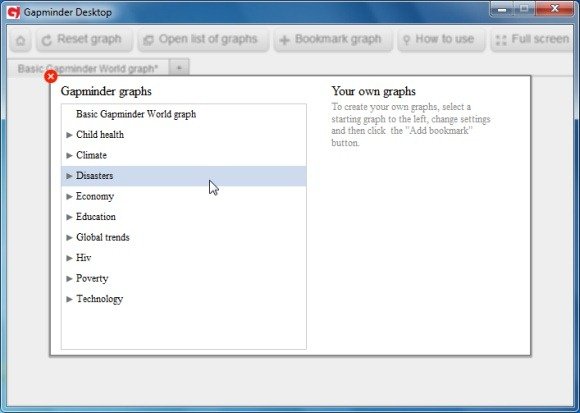
After you select a subject, related sub-topics can be selected to view statistical graphs.
The desktop application by Gapminder requires Adobe Air to be installed on your computer. Since Gapminder Desktop is an Adobe Air application, it works with various platforms including:
- Windows
- Mac OS X
- Linux
Go to Gapminder