Create Sophisticated Charts Using PowerPoint With Mekko Graphics
While many organizations use Microsoft Excel to organize large chunks of complex data, Excel is not the best application for presentations. Moreover, importing or linking data to and from an Excel sheet to presentation programs like PowerPoint isn’t easy. Mekko Graphics is a tool that has been designed to deliver elaborate business charting capabilities using Microsoft PowerPoint.
It is a PowerPoint add-in which seamlessly integrates to the program to deliver powerful features to help end users create complex charts more efficiently. The best feature of this tool is that it allows you to add complex data from your Excel spreadsheets and helps you translate it in the form of meaningful and easy to comprehend charts.

To try out Mekko Graphics you can sign up for a 10-day trial version. When downloading Mekko Graphics you will also be provided with a link to get the starter guide. This guide contains installation instructions and also shows the process by which you can purchase this tool. Mekko Graphics can be installed like any Windows application via an EXE file. Once it has been installed, simply select the 10 day trial option to evaluate it or enter your serial number (in case you have purchased it).
Add Chart Data To Automatically Create Charts
After installation you can use Mekko Graphics from an extra tab that will automatically be added to Microsoft PowerPoint. This tab will contain all necessary features to help you add charts, input data from your Excel sheets and to format your charts to suit your presentation needs. The below screenshot shows a Mekko Graphics chart with the Data Editor, which looks like an Excel spreadsheet. Using this data editor you can easily add required values to automatically populate the chart.
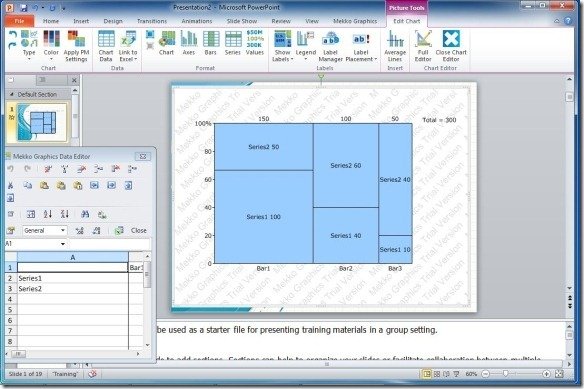
This is an example showing how to create a Marimekko Chart but you can also use this tool to make other types of charts including Bar-Mekko Chart, Cascade or Waterfall Chart, Cluster Bar Chart, X-Y log Bubble Chart and many other charts like Growth/Growth Bubble, Stoplight Charts (see Harvey Balls) or simple line charts.
Easily Organize Charts And Link Them To Microsoft Excel
Similarly, you can use the wide array of options from the Mekko Graphics tab in PowerPoint to format your charts by adding data, labeling legends, changing chart color, etc. Furthermore, you can also use the Link to Excel option to link your charts to MS Excel.

Mekko Graphics has three major packages including the $299 Single User package, the $179 (per user per year) Volume package with 32 chart types and the Enterprise package worth $69 per user per year.
Go to Mekko Graphics
We recently developed a PowerPoint plugin, called Aploris, that also helps in the creation of graphs like mekkos, waterfalls, and Gantt charts. Versions are available both for Windows and Apple computers. When designing Aploris, we aimed to ensure simplicity and to include features that help charts be insightful and easy to read. You are welcome to try it out, a free trial can be downloaded from our website.
Hi Claudius, thanks for your comment. We will love to learn more about your add-in for PowerPoint. Definitely a tool to help creating this kind of charts will be great.