How to Create Diagrams in PowerPoint for Decision Making Process
Decision making can be regarded as the mental processes or a cognitive process resulting in the selection of a course of action among several alternative scenarios and is a common task and process in business given that top managers and middle management need to take decisions rapidly. Even operators and employees are involved in the decision making process since they also need to take quickly decisions and sometimes these decisions are part of the core business. Think about a pilot in an aircraft taking last minute aviation decisions during a flight.
Even if many of the decisions are already stated in an aviation handbook real decisions need to be taken during the flight and that’s a core part of the aviation business and effectiveness of a flight.
Decision making is one of the defining characteristics of leadership. It’s core to the job description, making decisions is what managers and leaders are paid to do even middle management. It seems exponentially more so in the opening decade of the new millennium where everything seems marked with, “too big, too fast, too much, and too soon.”
The reality seems to be that most organizations aren’t overrun by good decision makers, yet alone great ones. When asked, people don’t easily point to what they regard as great decisions. Stories of bad decisions and bad decision-making come much more readily to mind.
Decision Making Process diagram in PowerPoint using SmartArt
Here we will see how to create a diagram in PowerPoint for decision making process. We already have seen how to create a decision making grid PPT template to evaluate against multiple alternatives and choices.
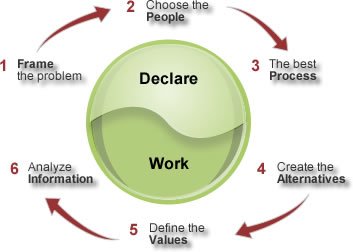
The decision making diagram above was taken from Decision Quality. We will try to create a similar copy of the diagram but using PowerPoint and SmartArt.
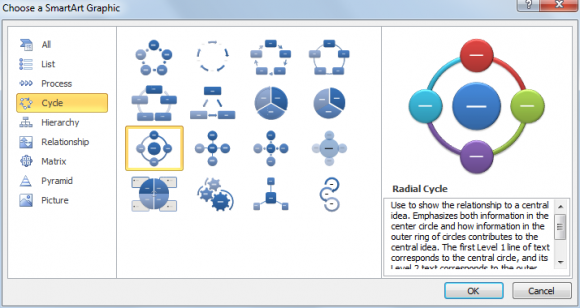
We can use the radial cycle diagram in PowerPoint. Accordingly to the PowerPoint help, it is used to show the relationship to a central idea. Emphasizes both information in the center circle and how information in the outer ring of circles contributes to the central idea. The first Level 1 line of text corresponds to the central circle, and its Level 2 text corresponds to the outer ring of circles. Unused text does not appear, but remains available if you switch layouts.
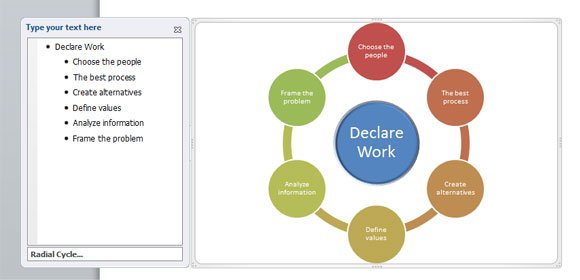
Then we can use the actions to embed the elements as shown below. Make sure to enter the steps of the process on each second level of the hierarchy and the central text Declare and Work at the top of the tree structure. For the child elements we will diagram the process with the following elements:
- Choose the people for the decision making process
- The best process
- Create alternatives
- Define values
- Analyze information
- Frame the problem
And finally after applying some changes to the color scheme and effects we get this Decision Making process diagram in PowerPoint using SmartArt.

You can download free diagrams for PowerPoint presentations to make DFD diagrams or data flow diagrams using Microsoft PowerPoint or you can find free PPT templates and slide designs with creative backgrounds for your presentations.